ON Semiconductor provides intelligent sensing and power solutions. Co. is organized into the following three segments: Power Solutions Group, which provides an array of analog, discrete, module and integrated semiconductor products; Advanced Solutions Group, which designs and develops analog, mixed-signal, advanced logic, application specific standard product and application specific integrated circuits, radio frequency and integrated power solutions; and Intelligent Sensing Group, which designs and develops complementary metal oxide semiconductor image sensors, image signal processors, single photon detectors, as well as actuator drivers for autofocus and image stabilization.
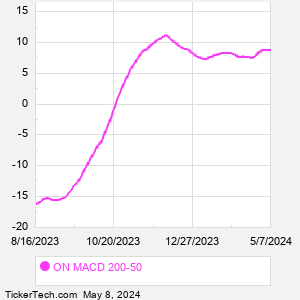
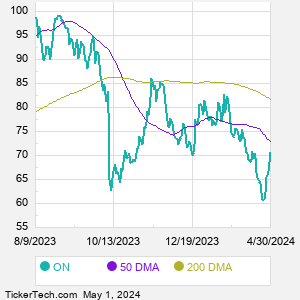
When researching a stock like ON Semiconductor, many investors are the most familiar with Fundamental Analysis — looking at a company's balance sheet, earnings, revenues, and what's happening in that company's underlying business. Investors who use Fundamental Analysis to identify good stocks to buy or sell can also benefit from ON Technical Analysis to help find a good entry or exit point. Technical Analysis is blind to the fundamentals and looks only at the trading data for ON stock — the real life supply and demand for the stock over time — and examines that data in different ways. One of those ways is to calculate a Simpe Moving Average ("SMA") by looking back a certain number of days. One of the most popular "longer look-backs" is the ON 200 day moving average ("ON 200 DMA"), while one of the most popular "shorter look-backs" is the ON 50 day moving average ("ON 50 DMA"). A chart showing both of these popular moving averages is shown on this page for ON Semiconductor. Comparing two moving averages against each other can be a useful visualization tool: by calculating the difference between the ON 200 DMA and the ON 50 DMA, we get a moving average convergence divergence indicator ("ON MACD"). The ON MACD chart, in conjunction with the chart of the moving averages, basically helps in visualizing how the moving averages are showing convergence (moving closer together), or divergence (moving farther apart). |