OXY MACD
As of date:9/28/2023
OXY stock price:65.88
OXY 50 DMA:63.55
OXY 200 DMA:61.44
OXY MACD (200-50):-2.11

Also see:
OXY Market Cap History
OXY Shares Outstanding History
OXY YTD Return
OXY DMA
OXY RSI
OXY Technical Analysis

Invesco Biotechnology & Genome Getting Very Oversold
1 hour, 22 minutes ago


Shares of XHE Now Oversold
1 hour, 23 minutes ago


First Trust Consumer Staples AlphaDEX Fund (FXG) Enters Oversold Territory
1 hour, 23 minutes ago


iShares Bloomberg Roll Select Commodity Strategy Breaks Below 200-Day Moving Average - Notable for CMDY
1 hour, 27 minutes ago


BCD Shares Cross Below 200 DMA
1 hour, 27 minutes ago


Bullish Two Hundred Day Moving Average Cross - WHF
1 hour, 29 minutes ago


Altius Minerals Breaks Above 200-Day Moving Average - Bullish for ATUSF
1 hour, 33 minutes ago


Altius Minerals Breaks Above 200-Day Moving Average - Bullish for ALS.CA
2 hours, 6 minutes ago


TECSYS Breaks Above 200-Day Moving Average - Bullish for TCS.CA
2 hours, 6 minutes ago


PG&E (PCG) Shares Enter Oversold Territory
2 hours, 6 minutes ago


OPRA Crosses Below Key Moving Average Level
6 hours, 2 minutes ago


GGAL Crosses Below Key Moving Average Level
6 hours, 2 minutes ago


FVCB Makes Bullish Cross Above Critical Moving Average
6 hours, 3 minutes ago


Commerzbank Breaks Above 200-Day Moving Average - Bullish for CRZBY
6 hours, 3 minutes ago


GGAL Crosses Below Key Moving Average Level
6 hours, 10 minutes ago


More Technical Analysis News

OXY MACDOXY DMA
Occidental Petroleum has three reporting segments: oil and gas, chemical and midstream and marketing. The oil and gas segment explores for, develops and produces oil (which includes condensate), natural gas liquids (NGL) and natural gas. The chemical segment primarily manufactures and markets basic chemicals and vinyls. The midstream and marketing segment purchases, markets, gathers, processes, transports and stores oil (which includes condensate), NGL, natural gas, carbon dioxide and power. The midstream and marketing segment also includes Co.'s low carbon ventures businesses, which primarily focus on developing carbon removal and carbon capture, utilization and storage projects.

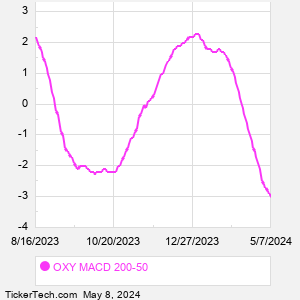
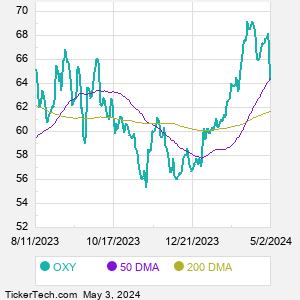
When researching a stock like Occidental Petroleum, many investors are the most familiar with Fundamental Analysis — looking at a company's balance sheet, earnings, revenues, and what's happening in that company's underlying business. Investors who use Fundamental Analysis to identify good stocks to buy or sell can also benefit from OXY Technical Analysis to help find a good entry or exit point. Technical Analysis is blind to the fundamentals and looks only at the trading data for OXY stock — the real life supply and demand for the stock over time — and examines that data in different ways. One of those ways is to calculate a Simpe Moving Average ("SMA") by looking back a certain number of days. One of the most popular "longer look-backs" is the OXY 200 day moving average ("OXY 200 DMA"), while one of the most popular "shorter look-backs" is the OXY 50 day moving average ("OXY 50 DMA"). A chart showing both of these popular moving averages is shown on this page for Occidental Petroleum. Comparing two moving averages against each other can be a useful visualization tool: by calculating the difference between the OXY 200 DMA and the OXY 50 DMA, we get a moving average convergence divergence indicator ("OXY MACD"). The OXY MACD chart, in conjunction with the chart of the moving averages, basically helps in visualizing how the moving averages are showing convergence (moving closer together), or divergence (moving farther apart).
10 Most Oversold S&P 500 Stocks
10 Most Overbought S&P 500 Stocks

10 ETFs With Stocks Insiders Are Buying
10 ETFs With Most Upside To Targets
The DividendRank Top 25
Warren Buffett Dividend Stocks
10 Cheap Dividend Stocks Under $10
10 Top DividendRank'ed Energy Stocks
The 10 Highest Yielding Preferred Stocks
The 15 Most Active S&P Call & Put Options
Quotes delayed 20 minutes

Email EnvelopeFree OXY Email Alerts:
Get Dividend Alerts
Get SEC Filing Alerts
Video: Technical Analysis


If the video does not load after a few moments, Upgrade to the Latest Flash Player.
Occidental Petroleum (OXY) is categorized under the Energy sector; to help you further research MACD, below are some other companies in the same sector:

PSX MACD
PXD MACD
SLB MACD
TRGP MACD
TT MACD
VLO MACD
WMB MACD
XOM MACD
APA MACD
BKR MACD
More Energy companies »


OXY MACD | www.StockMACD.com | Copyright © 2019 - 2023, All Rights Reserved

Nothing in StockMACD.com is intended to be investment advice, nor does it represent the opinion of, counsel from, or recommendations by BNK Invest Inc. or any of its affiliates, subsidiaries or partners. None of the information contained herein constitutes a recommendation that any particular security, portfolio, transaction, or investment strategy is suitable for any specific person. All viewers agree that under no circumstances will BNK Invest, Inc,. its subsidiaries, partners, officers, employees, affiliates, or agents be held liable for any loss or damage caused by your reliance on information obtained. By visiting, using or viewing this site, you agree to the following Full Disclaimer & Terms of Use and Privacy Policy. Video widget and market videos powered by Market News Video. Quote and option data delayed at least 15 minutes; stock quote data powered by Ticker Technologies, and Mergent.
X
Wait! Don't leave yet.
Want to receive our latest research absolutely free?


Click the button below for your complimentary copy of Your Early Retirement Portfolio: Dividends Up to 7.8%—Every Month—Forever.

You'll discover the details on 4 stocks and funds that pay you massive dividends as high as 7.8%.