People's United Financial is a bank holding company and a financial holding company. The principal business of Co. is to provide, through its subsidiary, People's United Bank, National Association and its subsidiaries, commercial banking, retail banking and wealth management services to individual, corporate and municipal customers. Co.'s reportable segments are: Commercial Banking, which includes commercial real estate lending, middle market and business banking, mortgage warehouse and asset-based lending; and Retail Banking, which includes consumer lending (including residential mortgage and home equity lending) and consumer deposit gathering activities.
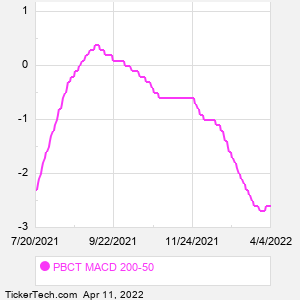
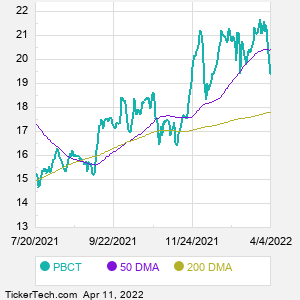
When researching a stock like Peoples United Financial, many investors are the most familiar with Fundamental Analysis — looking at a company's balance sheet, earnings, revenues, and what's happening in that company's underlying business. Investors who use Fundamental Analysis to identify good stocks to buy or sell can also benefit from PBCT Technical Analysis to help find a good entry or exit point. Technical Analysis is blind to the fundamentals and looks only at the trading data for PBCT stock — the real life supply and demand for the stock over time — and examines that data in different ways. One of those ways is to calculate a Simpe Moving Average ("SMA") by looking back a certain number of days. One of the most popular "longer look-backs" is the PBCT 200 day moving average ("PBCT 200 DMA"), while one of the most popular "shorter look-backs" is the PBCT 50 day moving average ("PBCT 50 DMA"). A chart showing both of these popular moving averages is shown on this page for Peoples United Financial. Comparing two moving averages against each other can be a useful visualization tool: by calculating the difference between the PBCT 200 DMA and the PBCT 50 DMA, we get a moving average convergence divergence indicator ("PBCT MACD"). The PBCT MACD chart, in conjunction with the chart of the moving averages, basically helps in visualizing how the moving averages are showing convergence (moving closer together), or divergence (moving farther apart). |