Parker Hannifin is a manufacturer of motion and control technologies and systems, providing engineered solutions for a variety of mobile, industrial and aerospace markets. Co. has two reporting segments: Diversified Industrial and Aerospace Systems. Co.'s Diversified Industrial segment products consist of a range of motion-control and fluid systems and components, which are categorized into the following groups: Engineered Materials, Filtration, Fluid Connectors, Instrumentation, and Motion Systems. Co.'s Aerospace Systems segment products are used in commercial and military airframe and engine programs and include: control actuation systems and components, and engine build-up ducting.
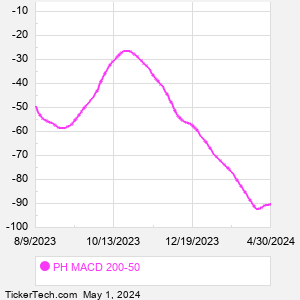
When researching a stock like Parker Hannifin, many investors are the most familiar with Fundamental Analysis — looking at a company's balance sheet, earnings, revenues, and what's happening in that company's underlying business. Investors who use Fundamental Analysis to identify good stocks to buy or sell can also benefit from PH Technical Analysis to help find a good entry or exit point. Technical Analysis is blind to the fundamentals and looks only at the trading data for PH stock — the real life supply and demand for the stock over time — and examines that data in different ways. One of those ways is to calculate a Simpe Moving Average ("SMA") by looking back a certain number of days. One of the most popular "longer look-backs" is the PH 200 day moving average ("PH 200 DMA"), while one of the most popular "shorter look-backs" is the PH 50 day moving average ("PH 50 DMA"). A chart showing both of these popular moving averages is shown on this page for Parker Hannifin. Comparing two moving averages against each other can be a useful visualization tool: by calculating the difference between the PH 200 DMA and the PH 50 DMA, we get a moving average convergence divergence indicator ("PH MACD"). The PH MACD chart, in conjunction with the chart of the moving averages, basically helps in visualizing how the moving averages are showing convergence (moving closer together), or divergence (moving farther apart). |