Philip Morris International is a holding company. Through its subsidiaries, Co. is an international tobacco company engaged in the manufacture and sale of cigarettes, as well as smoke-free products, associated electronic devices and accessories, and other nicotine-containing products in markets outside the U.S. Co. has a range of reduced-risk products in various stages of development, scientific assessment and commercialization. Co.'s IQOS smoke-free product brand portfolio includes heated tobacco and nicotine-containing vapor products. Co.'s smoke-free platform is a controlled device into which a heated tobacco unit is inserted and heated to generate an aerosol.
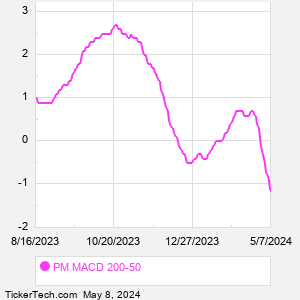
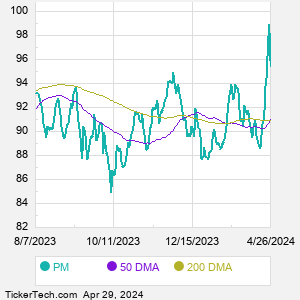
When researching a stock like Philip Morris International, many investors are the most familiar with Fundamental Analysis — looking at a company's balance sheet, earnings, revenues, and what's happening in that company's underlying business. Investors who use Fundamental Analysis to identify good stocks to buy or sell can also benefit from PM Technical Analysis to help find a good entry or exit point. Technical Analysis is blind to the fundamentals and looks only at the trading data for PM stock — the real life supply and demand for the stock over time — and examines that data in different ways. One of those ways is to calculate a Simpe Moving Average ("SMA") by looking back a certain number of days. One of the most popular "longer look-backs" is the PM 200 day moving average ("PM 200 DMA"), while one of the most popular "shorter look-backs" is the PM 50 day moving average ("PM 50 DMA"). A chart showing both of these popular moving averages is shown on this page for Philip Morris International. Comparing two moving averages against each other can be a useful visualization tool: by calculating the difference between the PM 200 DMA and the PM 50 DMA, we get a moving average convergence divergence indicator ("PM MACD"). The PM MACD chart, in conjunction with the chart of the moving averages, basically helps in visualizing how the moving averages are showing convergence (moving closer together), or divergence (moving farther apart). |