PulteGroup, through its subsidiaries, engages primarily in the homebuilding business. Co. also has financial services businesses, including mortgage banking, conducted principally through its subsidiary, Pulte Mortgage LLC, title, and insurance brokerage operations. Co.'s Homebuilding operations are located within the U.S. Through its brands, which include Centex, Pulte Homes, Del Webb, DiVosta Homes, and American West, Co. provides a variety of home designs with varying levels of options and amenities to its customer groups: first-time, move-up, and active adult. Co. primarily sells single-family detached homes. Co. also sells attached homes, such as townhomes, condominiums, and duplexes.
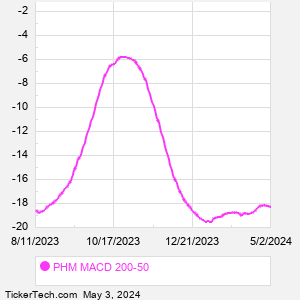
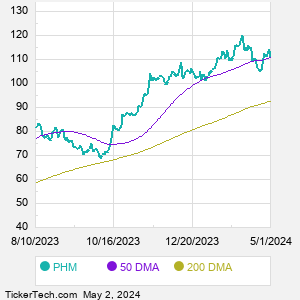
When researching a stock like PulteGroup, many investors are the most familiar with Fundamental Analysis — looking at a company's balance sheet, earnings, revenues, and what's happening in that company's underlying business. Investors who use Fundamental Analysis to identify good stocks to buy or sell can also benefit from PHM Technical Analysis to help find a good entry or exit point. Technical Analysis is blind to the fundamentals and looks only at the trading data for PHM stock — the real life supply and demand for the stock over time — and examines that data in different ways. One of those ways is to calculate a Simpe Moving Average ("SMA") by looking back a certain number of days. One of the most popular "longer look-backs" is the PHM 200 day moving average ("PHM 200 DMA"), while one of the most popular "shorter look-backs" is the PHM 50 day moving average ("PHM 50 DMA"). A chart showing both of these popular moving averages is shown on this page for PulteGroup. Comparing two moving averages against each other can be a useful visualization tool: by calculating the difference between the PHM 200 DMA and the PHM 50 DMA, we get a moving average convergence divergence indicator ("PHM MACD"). The PHM MACD chart, in conjunction with the chart of the moving averages, basically helps in visualizing how the moving averages are showing convergence (moving closer together), or divergence (moving farther apart). |