| PXD MACD Data | ||||||||||
Also see: |


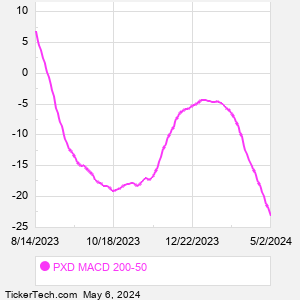
| PXD MACD Chart |
  |
| About Pioneer Natural Resources Co |
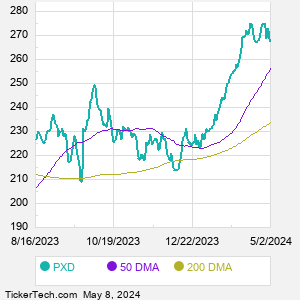
| Pioneer Natural Resources is a holding company. Through its subsidiaries, Co. is an independent oil and gas exploration and production company that explores for, develops and produces oil, natural gas liquids and gas in the Midland Basin in West Texas. When researching a stock like Pioneer Natural Resources, many investors are the most familiar with Fundamental Analysis — looking at a company's balance sheet, earnings, revenues, and what's happening in that company's underlying business. Investors who use Fundamental Analysis to identify good stocks to buy or sell can also benefit from PXD Technical Analysis to help find a good entry or exit point. Technical Analysis is blind to the fundamentals and looks only at the trading data for PXD stock — the real life supply and demand for the stock over time — and examines that data in different ways. One of those ways is to calculate a Simpe Moving Average ("SMA") by looking back a certain number of days. One of the most popular "longer look-backs" is the PXD 200 day moving average ("PXD 200 DMA"), while one of the most popular "shorter look-backs" is the PXD 50 day moving average ("PXD 50 DMA"). A chart showing both of these popular moving averages is shown on this page for Pioneer Natural Resources. Comparing two moving averages against each other can be a useful visualization tool: by calculating the difference between the PXD 200 DMA and the PXD 50 DMA, we get a moving average convergence divergence indicator ("PXD MACD"). The PXD MACD chart, in conjunction with the chart of the moving averages, basically helps in visualizing how the moving averages are showing convergence (moving closer together), or divergence (moving farther apart). |
| PXD Current Stock Quote |
Get Dividend Alerts Get SEC Filing Alerts |
| PXD Stock Price Chart |
| Video: Technical Analysis | |
|
| PXD MACD Peers |
| Pioneer Natural Resources (PXD) is categorized under the Energy sector; to help you further research MACD, below are some other companies in the same sector:
SLB MACD |