Qualcomm engages in the development and commercialization of foundational technologies for the wireless industry. Co.'s segments are: Qualcomm Code Division Multiple Access Technologies, which is a developer and supplier of integrated circuits and system software based on third generation/fourth generation/fifth generation and other technologies; Qualcomm Technology Licensing, which grants licenses or otherwise provides rights to use portions of its intellectual property portfolio, that, among other rights, includes certain patent rights essential to and/or useful in the manufacture, sale and/or use of certain wireless products; and Qualcomm Strategic Initiatives, which makes investments.
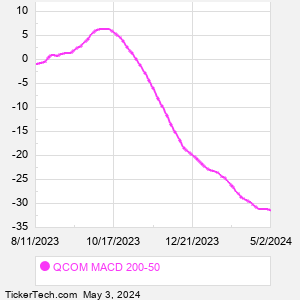
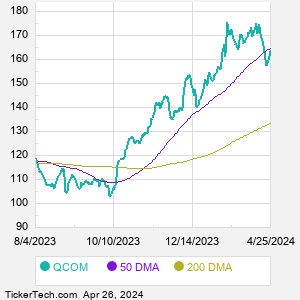
When researching a stock like Qualcomm, many investors are the most familiar with Fundamental Analysis — looking at a company's balance sheet, earnings, revenues, and what's happening in that company's underlying business. Investors who use Fundamental Analysis to identify good stocks to buy or sell can also benefit from QCOM Technical Analysis to help find a good entry or exit point. Technical Analysis is blind to the fundamentals and looks only at the trading data for QCOM stock — the real life supply and demand for the stock over time — and examines that data in different ways. One of those ways is to calculate a Simpe Moving Average ("SMA") by looking back a certain number of days. One of the most popular "longer look-backs" is the QCOM 200 day moving average ("QCOM 200 DMA"), while one of the most popular "shorter look-backs" is the QCOM 50 day moving average ("QCOM 50 DMA"). A chart showing both of these popular moving averages is shown on this page for Qualcomm. Comparing two moving averages against each other can be a useful visualization tool: by calculating the difference between the QCOM 200 DMA and the QCOM 50 DMA, we get a moving average convergence divergence indicator ("QCOM MACD"). The QCOM MACD chart, in conjunction with the chart of the moving averages, basically helps in visualizing how the moving averages are showing convergence (moving closer together), or divergence (moving farther apart). |