Royal Caribbean Group is a cruise company. Co. owns and operates three global cruise brands: Royal Caribbean International, Celebrity Cruises and Silversea Cruises (collectively, Global Brands). Co. also owns a joint venture interest in TUI Cruises GmbH, which operates the German brands TUI Cruises and Hapag-Lloyd Cruises (collectively, Partner Brands). Co.'s Global Brands and its Partner Brands have ships in the cruise vacation industry. Co.'s ships provide worldwide itineraries that call on several continents. Co. handles various travel aspects related to guest reservations and transportation, including facilitating guest pre- and post-hotel stay arrangements and air transportation.
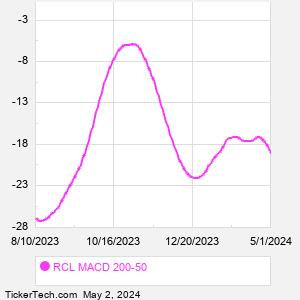
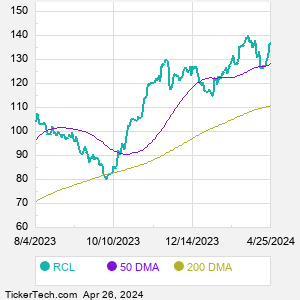
When researching a stock like Royal Caribbean Cruises, many investors are the most familiar with Fundamental Analysis — looking at a company's balance sheet, earnings, revenues, and what's happening in that company's underlying business. Investors who use Fundamental Analysis to identify good stocks to buy or sell can also benefit from RCL Technical Analysis to help find a good entry or exit point. Technical Analysis is blind to the fundamentals and looks only at the trading data for RCL stock — the real life supply and demand for the stock over time — and examines that data in different ways. One of those ways is to calculate a Simpe Moving Average ("SMA") by looking back a certain number of days. One of the most popular "longer look-backs" is the RCL 200 day moving average ("RCL 200 DMA"), while one of the most popular "shorter look-backs" is the RCL 50 day moving average ("RCL 50 DMA"). A chart showing both of these popular moving averages is shown on this page for Royal Caribbean Cruises. Comparing two moving averages against each other can be a useful visualization tool: by calculating the difference between the RCL 200 DMA and the RCL 50 DMA, we get a moving average convergence divergence indicator ("RCL MACD"). The RCL MACD chart, in conjunction with the chart of the moving averages, basically helps in visualizing how the moving averages are showing convergence (moving closer together), or divergence (moving farther apart). |