Regeneron Pharmaceuticals is a biotechnology company. Co.'s products include: EYLEA, which is designed for the treatment of neovascular age-related macular degeneration, diabetic macular edema, macular edema, myopic choroidal neovascularization, diabetic retinopathy, neovascular glaucoma and retinopathy of prematurity; Dupixent, which is designed for the treatment of atopic dermatitis, asthma, rhinosinusitis with nasal polyposis, eosinophilic esophagitis (in adults and adolescents) and prurigo nodularis; and Libtayo, which is designed for the treatment of metastatic or locally advanced first-line non-small cell lung cancer and metastatic or recurrent second-line cervical cancer.
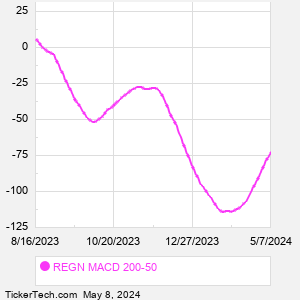
When researching a stock like Regeneron Pharmaceuticals, many investors are the most familiar with Fundamental Analysis — looking at a company's balance sheet, earnings, revenues, and what's happening in that company's underlying business. Investors who use Fundamental Analysis to identify good stocks to buy or sell can also benefit from REGN Technical Analysis to help find a good entry or exit point. Technical Analysis is blind to the fundamentals and looks only at the trading data for REGN stock — the real life supply and demand for the stock over time — and examines that data in different ways. One of those ways is to calculate a Simpe Moving Average ("SMA") by looking back a certain number of days. One of the most popular "longer look-backs" is the REGN 200 day moving average ("REGN 200 DMA"), while one of the most popular "shorter look-backs" is the REGN 50 day moving average ("REGN 50 DMA"). A chart showing both of these popular moving averages is shown on this page for Regeneron Pharmaceuticals. Comparing two moving averages against each other can be a useful visualization tool: by calculating the difference between the REGN 200 DMA and the REGN 50 DMA, we get a moving average convergence divergence indicator ("REGN MACD"). The REGN MACD chart, in conjunction with the chart of the moving averages, basically helps in visualizing how the moving averages are showing convergence (moving closer together), or divergence (moving farther apart). |