Sherwin-Williams develops, manufactures, distributes and sells paint, coatings and related products. Co.'s Americas Group is engaged in servicing the needs of architectural and industrial paint contractors and do-it-yourself homeowners. Co.'s Consumer Brands Group supplies architectural paint, stains, varnishes, industrial products, wood finishes products, wood preservatives, applicators, corrosion inhibitors, aerosols, caulks and adhesives. Co.'s Performance Coatings Group develops and sells industrial coatings for wood finishing and general industrial applications, automotive refinish, protective and marine coatings and packaging coatings and performance-based resins.
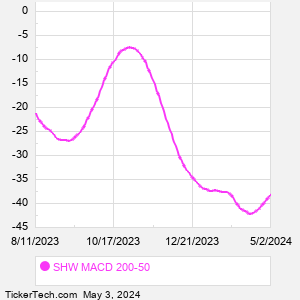
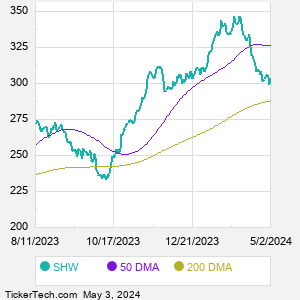
When researching a stock like Sherwin-Williams, many investors are the most familiar with Fundamental Analysis — looking at a company's balance sheet, earnings, revenues, and what's happening in that company's underlying business. Investors who use Fundamental Analysis to identify good stocks to buy or sell can also benefit from SHW Technical Analysis to help find a good entry or exit point. Technical Analysis is blind to the fundamentals and looks only at the trading data for SHW stock — the real life supply and demand for the stock over time — and examines that data in different ways. One of those ways is to calculate a Simpe Moving Average ("SMA") by looking back a certain number of days. One of the most popular "longer look-backs" is the SHW 200 day moving average ("SHW 200 DMA"), while one of the most popular "shorter look-backs" is the SHW 50 day moving average ("SHW 50 DMA"). A chart showing both of these popular moving averages is shown on this page for Sherwin-Williams. Comparing two moving averages against each other can be a useful visualization tool: by calculating the difference between the SHW 200 DMA and the SHW 50 DMA, we get a moving average convergence divergence indicator ("SHW MACD"). The SHW MACD chart, in conjunction with the chart of the moving averages, basically helps in visualizing how the moving averages are showing convergence (moving closer together), or divergence (moving farther apart). |