Seagate Technology Holdings is a provider of data storage technology and solutions. Co.'s principal products are hard disk drives (HDDs). In addition, Co. produces a range of data storage products including solid state drives (SSDs) and storage subsystems and provides storage solutions such as a edge-to-cloud mass data platform that includes data transfer shuttles and a storage-as-a-service cloud. Co. provides a range of storage solutions for mass capacity storage which includes: Enterprise Nearline HDDs, Enterprise Nearline SSDs, Enterprise Nearline Systems, Video and Image Applications and Network-attached storage.
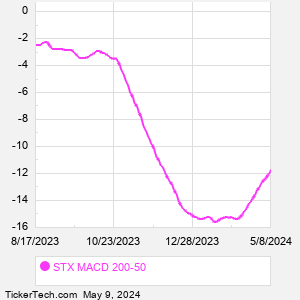
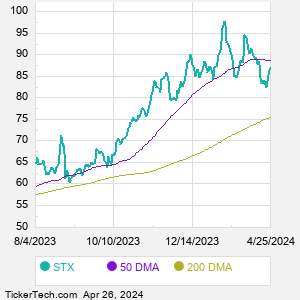
When researching a stock like Seagate Technology, many investors are the most familiar with Fundamental Analysis — looking at a company's balance sheet, earnings, revenues, and what's happening in that company's underlying business. Investors who use Fundamental Analysis to identify good stocks to buy or sell can also benefit from STX Technical Analysis to help find a good entry or exit point. Technical Analysis is blind to the fundamentals and looks only at the trading data for STX stock — the real life supply and demand for the stock over time — and examines that data in different ways. One of those ways is to calculate a Simpe Moving Average ("SMA") by looking back a certain number of days. One of the most popular "longer look-backs" is the STX 200 day moving average ("STX 200 DMA"), while one of the most popular "shorter look-backs" is the STX 50 day moving average ("STX 50 DMA"). A chart showing both of these popular moving averages is shown on this page for Seagate Technology. Comparing two moving averages against each other can be a useful visualization tool: by calculating the difference between the STX 200 DMA and the STX 50 DMA, we get a moving average convergence divergence indicator ("STX MACD"). The STX MACD chart, in conjunction with the chart of the moving averages, basically helps in visualizing how the moving averages are showing convergence (moving closer together), or divergence (moving farther apart). |