Synchrony Financial is a savings and loan holding company and financial holding company. Through its subsidiaries, Co. provides a range of credit products through programs it has established with a group of national and regional retailers, local merchants, manufacturers, buying groups, industry associations and healthcare service providers, which it refers to as its partners. Co.'s capabilities and scale encompass a spectrum of industries, including digital, health and wellness, retail, telecommunications, home, auto, outdoor, pet and more. Co. conducts its operations through a single segment. Co. provides its credit products primarily through its wholly-owned subsidiary, Synchrony Bank.
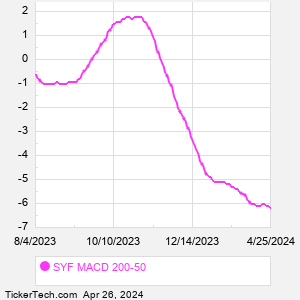
When researching a stock like Synchrony Financial, many investors are the most familiar with Fundamental Analysis — looking at a company's balance sheet, earnings, revenues, and what's happening in that company's underlying business. Investors who use Fundamental Analysis to identify good stocks to buy or sell can also benefit from SYF Technical Analysis to help find a good entry or exit point. Technical Analysis is blind to the fundamentals and looks only at the trading data for SYF stock — the real life supply and demand for the stock over time — and examines that data in different ways. One of those ways is to calculate a Simpe Moving Average ("SMA") by looking back a certain number of days. One of the most popular "longer look-backs" is the SYF 200 day moving average ("SYF 200 DMA"), while one of the most popular "shorter look-backs" is the SYF 50 day moving average ("SYF 50 DMA"). A chart showing both of these popular moving averages is shown on this page for Synchrony Financial. Comparing two moving averages against each other can be a useful visualization tool: by calculating the difference between the SYF 200 DMA and the SYF 50 DMA, we get a moving average convergence divergence indicator ("SYF MACD"). The SYF MACD chart, in conjunction with the chart of the moving averages, basically helps in visualizing how the moving averages are showing convergence (moving closer together), or divergence (moving farther apart). |