| TRGP MACD Data | ||||||||||
Also see: |


| TRGP MACD Chart |
  |
| About Targa Resources Corp |
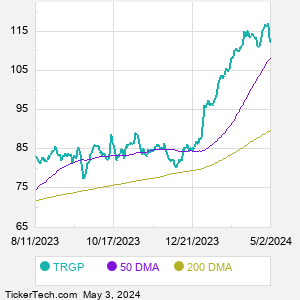
| Targa Resources is a provider of midstream services and midstream infrastructure company in North America. Co. operates in two main segments: Gathering and Processing, which includes assets used in the gathering and/or purchase and sale of natural gas produced from oil and gas wells, removing impurities and processing this raw natural gas into merchantable natural gas by extracting natural gas liquids (NGL); and assets used for the gathering and terminaling and/or purchase and sale of crude oil; and Logistics and Transportation, which includes the activities and assets necessary to convert mixed NGLs into NGL products and also includes other assets and services. When researching a stock like Targa Resources, many investors are the most familiar with Fundamental Analysis — looking at a company's balance sheet, earnings, revenues, and what's happening in that company's underlying business. Investors who use Fundamental Analysis to identify good stocks to buy or sell can also benefit from TRGP Technical Analysis to help find a good entry or exit point. Technical Analysis is blind to the fundamentals and looks only at the trading data for TRGP stock — the real life supply and demand for the stock over time — and examines that data in different ways. One of those ways is to calculate a Simpe Moving Average ("SMA") by looking back a certain number of days. One of the most popular "longer look-backs" is the TRGP 200 day moving average ("TRGP 200 DMA"), while one of the most popular "shorter look-backs" is the TRGP 50 day moving average ("TRGP 50 DMA"). A chart showing both of these popular moving averages is shown on this page for Targa Resources. Comparing two moving averages against each other can be a useful visualization tool: by calculating the difference between the TRGP 200 DMA and the TRGP 50 DMA, we get a moving average convergence divergence indicator ("TRGP MACD"). The TRGP MACD chart, in conjunction with the chart of the moving averages, basically helps in visualizing how the moving averages are showing convergence (moving closer together), or divergence (moving farther apart). |
| TRGP Current Stock Quote |
Get Dividend Alerts Get SEC Filing Alerts |
| TRGP Stock Price Chart |
| Video: Technical Analysis | |
|
| TRGP MACD Peers |
| Targa Resources (TRGP) is categorized under the Energy sector; to help you further research MACD, below are some other companies in the same sector:
TT MACD |