Teradyne is a supplier of automation equipment for test and industrial applications. Co. designs, develops, manufactures and sells automatic test systems used to test semiconductors, wireless products, data storage and electronics systems in several industries including consumer electronics, wireless, automotive, industrial, computing, communications, and aerospace and defense industries. Co.'s industrial automation products include collaborative robotic arms, autonomous mobile robots and robotic control software. Co.'s automatic test equipment and industrial automation products and services include: Semiconductor Test; System Test; wireless test systems; and industrial automation products.
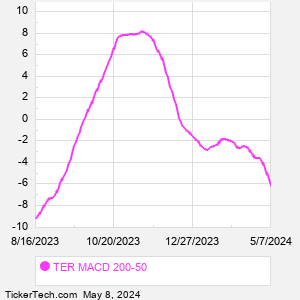
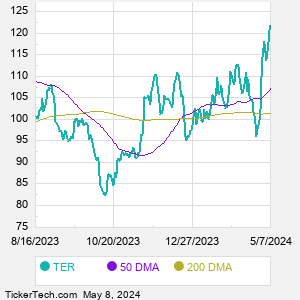
When researching a stock like Teradyne, many investors are the most familiar with Fundamental Analysis — looking at a company's balance sheet, earnings, revenues, and what's happening in that company's underlying business. Investors who use Fundamental Analysis to identify good stocks to buy or sell can also benefit from TER Technical Analysis to help find a good entry or exit point. Technical Analysis is blind to the fundamentals and looks only at the trading data for TER stock — the real life supply and demand for the stock over time — and examines that data in different ways. One of those ways is to calculate a Simpe Moving Average ("SMA") by looking back a certain number of days. One of the most popular "longer look-backs" is the TER 200 day moving average ("TER 200 DMA"), while one of the most popular "shorter look-backs" is the TER 50 day moving average ("TER 50 DMA"). A chart showing both of these popular moving averages is shown on this page for Teradyne. Comparing two moving averages against each other can be a useful visualization tool: by calculating the difference between the TER 200 DMA and the TER 50 DMA, we get a moving average convergence divergence indicator ("TER MACD"). The TER MACD chart, in conjunction with the chart of the moving averages, basically helps in visualizing how the moving averages are showing convergence (moving closer together), or divergence (moving farther apart). |