Textron is a multi-industry company. Co.'s segments are: Textron Aviation, which manufactures, sells and services Beechcraft and Cessna aircraft, and services the Hawker brand of business jets; Bell, which supplies military and commercial helicopters, tiltrotor aircraft, and related spare parts and services; Textron Systems, which includes unmanned aircraft systems, electronic systems and solutions, marine craft, piston aircraft engines, live military air-to-air and air-to-ship training; Industrial, which designs and manufactures various products within the Fuel Systems and Functional Components and Specialized Vehicles product lines; and Finance, which is a commercial finance business.
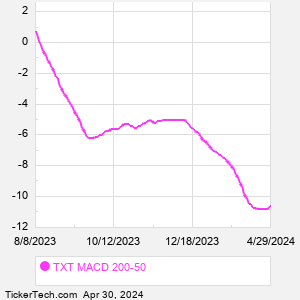
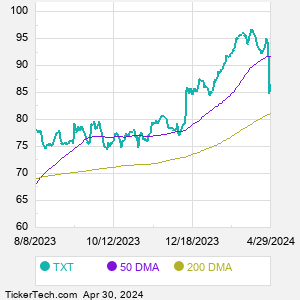
When researching a stock like Textron, many investors are the most familiar with Fundamental Analysis — looking at a company's balance sheet, earnings, revenues, and what's happening in that company's underlying business. Investors who use Fundamental Analysis to identify good stocks to buy or sell can also benefit from TXT Technical Analysis to help find a good entry or exit point. Technical Analysis is blind to the fundamentals and looks only at the trading data for TXT stock — the real life supply and demand for the stock over time — and examines that data in different ways. One of those ways is to calculate a Simpe Moving Average ("SMA") by looking back a certain number of days. One of the most popular "longer look-backs" is the TXT 200 day moving average ("TXT 200 DMA"), while one of the most popular "shorter look-backs" is the TXT 50 day moving average ("TXT 50 DMA"). A chart showing both of these popular moving averages is shown on this page for Textron. Comparing two moving averages against each other can be a useful visualization tool: by calculating the difference between the TXT 200 DMA and the TXT 50 DMA, we get a moving average convergence divergence indicator ("TXT MACD"). The TXT MACD chart, in conjunction with the chart of the moving averages, basically helps in visualizing how the moving averages are showing convergence (moving closer together), or divergence (moving farther apart). |