Target provides its customers everyday essentials and merchandise. Co. sells an assortment of general merchandise and food. The majority of Co.'s general merchandise stores provide an edited food assortment, including perishables, dry grocery, dairy, and frozen items. Co.'s small format stores provide curated general merchandise and food assortments. Co.'s digital channels include a merchandise assortment, including various items found in its stores, along with a complementary assortment sold by Co. and third parties. Co.'s owned brands include: A New Day™, All in Motion™, Archer Farms™, Art Class™, Auden™, Ava & Viv™, Boots & Barkley®, Brightroom™, and Bullseye's Playground™, among others.
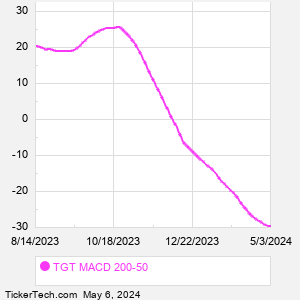
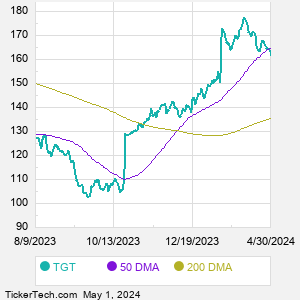
When researching a stock like Target, many investors are the most familiar with Fundamental Analysis — looking at a company's balance sheet, earnings, revenues, and what's happening in that company's underlying business. Investors who use Fundamental Analysis to identify good stocks to buy or sell can also benefit from TGT Technical Analysis to help find a good entry or exit point. Technical Analysis is blind to the fundamentals and looks only at the trading data for TGT stock — the real life supply and demand for the stock over time — and examines that data in different ways. One of those ways is to calculate a Simpe Moving Average ("SMA") by looking back a certain number of days. One of the most popular "longer look-backs" is the TGT 200 day moving average ("TGT 200 DMA"), while one of the most popular "shorter look-backs" is the TGT 50 day moving average ("TGT 50 DMA"). A chart showing both of these popular moving averages is shown on this page for Target. Comparing two moving averages against each other can be a useful visualization tool: by calculating the difference between the TGT 200 DMA and the TGT 50 DMA, we get a moving average convergence divergence indicator ("TGT MACD"). The TGT MACD chart, in conjunction with the chart of the moving averages, basically helps in visualizing how the moving averages are showing convergence (moving closer together), or divergence (moving farther apart). |