TJX Companies MACD


TJX MACDTJX DMA
TJX Companies is an off-price apparel and home fashions retailer. Co.'s segments are: Marmaxx, which operates the T.J. Maxx and Marshalls chains in the U.S. that sell family apparel, home fashions and other merchandise, and Sierra chain that sells outdoor apparel, footwear, and gear; HomeGoods, which provides an assortment of home fashions, including furniture, rugs, lighting, soft home, decorative accessories, tabletop and cookware, as well as pet and gourmet food departments; TJX Canada, which operates the Winners, HomeSense and Marshalls chains in Canada; and TJX International, which operates the T.K. Maxx and Homesense chains in Europe and the T.K. Maxx chain in Australia.

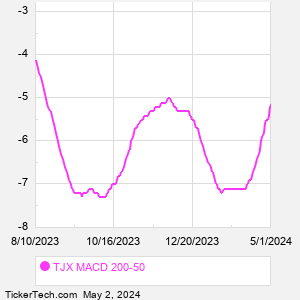
When researching a stock like TJX Companies, many investors are the most familiar with Fundamental Analysis — looking at a company's balance sheet, earnings, revenues, and what's happening in that company's underlying business. Investors who use Fundamental Analysis to identify good stocks to buy or sell can also benefit from TJX Technical Analysis to help find a good entry or exit point. Technical Analysis is blind to the fundamentals and looks only at the trading data for TJX stock — the real life supply and demand for the stock over time — and examines that data in different ways. One of those ways is to calculate a Simpe Moving Average ("SMA") by looking back a certain number of days. One of the most popular "longer look-backs" is the TJX 200 day moving average ("TJX 200 DMA"), while one of the most popular "shorter look-backs" is the TJX 50 day moving average ("TJX 50 DMA"). A chart showing both of these popular moving averages is shown on this page for TJX Companies. Comparing two moving averages against each other can be a useful visualization tool: by calculating the difference between the TJX 200 DMA and the TJX 50 DMA, we get a moving average convergence divergence indicator ("TJX MACD"). The TJX MACD chart, in conjunction with the chart of the moving averages, basically helps in visualizing how the moving averages are showing convergence (moving closer together), or divergence (moving farther apart).
10 Most Oversold S&P 500 Stocks
10 Most Overbought S&P 500 Stocks

10 ETFs With Stocks Insiders Are Buying
10 ETFs With Most Upside To Targets
The DividendRank Top 25
Warren Buffett Dividend Stocks
10 Cheap Dividend Stocks Under $10
10 Top DividendRank'ed Energy Stocks
The 10 Highest Yielding Preferred Stocks
The 15 Most Active S&P Call & Put Options
Quotes delayed 20 minutes

Email EnvelopeFree TJX Email Alerts:
Get Dividend Alerts
Get SEC Filing Alerts
Video: Technical Analysis


If the video does not load after a few moments, Upgrade to the Latest Flash Player.
TJX Companies (TJX) is categorized under the Services sector; to help you further research MACD, below are some other companies in the same sector:

TSCO MACD
ULTA MACD
WBA MACD
WBD MACD
WMT MACD
WTW MACD
WYNN MACD
YUM MACD
AMZN MACD
AZO MACD
More Services companies »


TJX Companies MACD | www.StockMACD.com | Copyright © 2019 - 2024, All Rights Reserved

Nothing in StockMACD.com is intended to be investment advice, nor does it represent the opinion of, counsel from, or recommendations by BNK Invest Inc. or any of its affiliates, subsidiaries or partners. None of the information contained herein constitutes a recommendation that any particular security, portfolio, transaction, or investment strategy is suitable for any specific person. All viewers agree that under no circumstances will BNK Invest, Inc,. its subsidiaries, partners, officers, employees, affiliates, or agents be held liable for any loss or damage caused by your reliance on information obtained. By visiting, using or viewing this site, you agree to the following Full Disclaimer & Terms of Use and Privacy Policy. Video widget and market videos powered by Market News Video. Quote and option data delayed at least 15 minutes; stock quote data powered by Ticker Technologies, and Mergent.
X
Wait! Don't leave yet.
Want to receive our latest research absolutely free?


Click the button below for your complimentary copy of Your Early Retirement Portfolio: Dividends Up to 8.7%—Every Month—Forever.

You'll discover the details on 4 stocks and funds that pay you massive dividends as high as 8.7%.