Tyler Technologies provides integrated information management solutions and services for the public sector. Co.'s software solutions and services include: financial management, education and planning, regulatory, and maintenance software solutions; financial management, municipal courts, planning, regulatory, and maintenance software solutions; courts and justice and public safety software solutions; data and insights solutions; appraisal and tax software solutions, land and vital records management software solutions, and property appraisal services; development platform solutions including case management and business process management; and digital government and payments solutions.
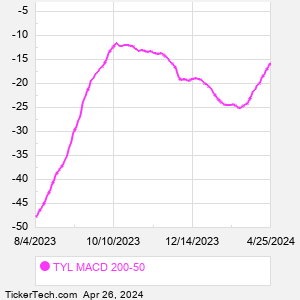
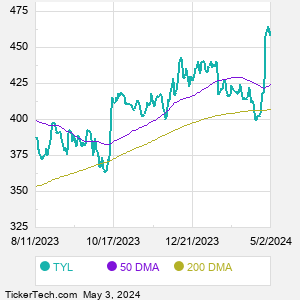
When researching a stock like Tyler Technologies, many investors are the most familiar with Fundamental Analysis — looking at a company's balance sheet, earnings, revenues, and what's happening in that company's underlying business. Investors who use Fundamental Analysis to identify good stocks to buy or sell can also benefit from TYL Technical Analysis to help find a good entry or exit point. Technical Analysis is blind to the fundamentals and looks only at the trading data for TYL stock — the real life supply and demand for the stock over time — and examines that data in different ways. One of those ways is to calculate a Simpe Moving Average ("SMA") by looking back a certain number of days. One of the most popular "longer look-backs" is the TYL 200 day moving average ("TYL 200 DMA"), while one of the most popular "shorter look-backs" is the TYL 50 day moving average ("TYL 50 DMA"). A chart showing both of these popular moving averages is shown on this page for Tyler Technologies. Comparing two moving averages against each other can be a useful visualization tool: by calculating the difference between the TYL 200 DMA and the TYL 50 DMA, we get a moving average convergence divergence indicator ("TYL MACD"). The TYL MACD chart, in conjunction with the chart of the moving averages, basically helps in visualizing how the moving averages are showing convergence (moving closer together), or divergence (moving farther apart). |