Union Pacific, through its principal operating subsidiary, Union Pacific Railroad Company, is a Class I railroad operating in the U.S. Co.'s network includes route miles, connecting Pacific Coast and Gulf Coast ports with the Midwest and Eastern U.S. gateways and providing several corridors to main Mexican and Canadian gateways. Co. serves the western two-thirds of the country and maintain coordinated schedules with other rail carriers to move freight to and from the Atlantic Coast, the Pacific Coast, the Southeast, the Southwest, Canada, and Mexico. Co. has Bulk, Industrial, and Premium commodity groups.
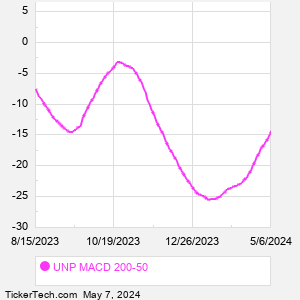
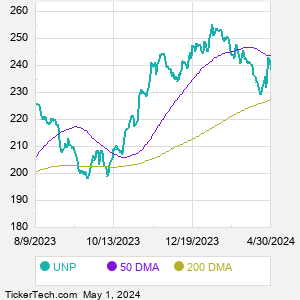
When researching a stock like Union Pacific, many investors are the most familiar with Fundamental Analysis — looking at a company's balance sheet, earnings, revenues, and what's happening in that company's underlying business. Investors who use Fundamental Analysis to identify good stocks to buy or sell can also benefit from UNP Technical Analysis to help find a good entry or exit point. Technical Analysis is blind to the fundamentals and looks only at the trading data for UNP stock — the real life supply and demand for the stock over time — and examines that data in different ways. One of those ways is to calculate a Simpe Moving Average ("SMA") by looking back a certain number of days. One of the most popular "longer look-backs" is the UNP 200 day moving average ("UNP 200 DMA"), while one of the most popular "shorter look-backs" is the UNP 50 day moving average ("UNP 50 DMA"). A chart showing both of these popular moving averages is shown on this page for Union Pacific. Comparing two moving averages against each other can be a useful visualization tool: by calculating the difference between the UNP 200 DMA and the UNP 50 DMA, we get a moving average convergence divergence indicator ("UNP MACD"). The UNP MACD chart, in conjunction with the chart of the moving averages, basically helps in visualizing how the moving averages are showing convergence (moving closer together), or divergence (moving farther apart). |