Verisk Analytics is a holding company. Through its subsidiaries, Co. is a data analytics provider serving customers in the insurance and energy market. Co. provides predictive analytics and decision support solutions to customers in rating, underwriting, claims, catastrophe, weather risk and other fields. In the US and around the world, Co. helps customers protect people, property, and financial assets. Co. has one operating segment: Insurance. Co. is a provider of statistical, actuarial, and underwriting data for the U.S. property and casualty insurance industry.
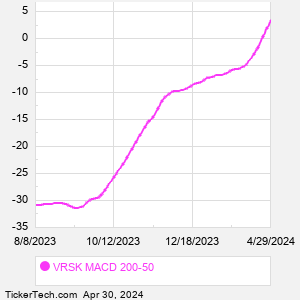
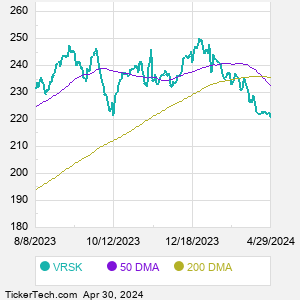
When researching a stock like Verisk Analytics, many investors are the most familiar with Fundamental Analysis — looking at a company's balance sheet, earnings, revenues, and what's happening in that company's underlying business. Investors who use Fundamental Analysis to identify good stocks to buy or sell can also benefit from VRSK Technical Analysis to help find a good entry or exit point. Technical Analysis is blind to the fundamentals and looks only at the trading data for VRSK stock — the real life supply and demand for the stock over time — and examines that data in different ways. One of those ways is to calculate a Simpe Moving Average ("SMA") by looking back a certain number of days. One of the most popular "longer look-backs" is the VRSK 200 day moving average ("VRSK 200 DMA"), while one of the most popular "shorter look-backs" is the VRSK 50 day moving average ("VRSK 50 DMA"). A chart showing both of these popular moving averages is shown on this page for Verisk Analytics. Comparing two moving averages against each other can be a useful visualization tool: by calculating the difference between the VRSK 200 DMA and the VRSK 50 DMA, we get a moving average convergence divergence indicator ("VRSK MACD"). The VRSK MACD chart, in conjunction with the chart of the moving averages, basically helps in visualizing how the moving averages are showing convergence (moving closer together), or divergence (moving farther apart). |