Verisign is a provider of domain name registry services and internet infrastructure, enabling internet navigation for various domain names. Co. enables the security, stability, and resiliency of key internet infrastructure and services, including providing root zone maintainer services, operating various global internet root servers, and providing registration services and authoritative resolution for the .com and .net top-level domains, which support the majority of global e-commerce. Co. operates the authoritative directory of and/or the back-end systems for all .com, .net, .cc, .gov, .edu and .name domain names, among others. Co. also provides internationalized domain name services.
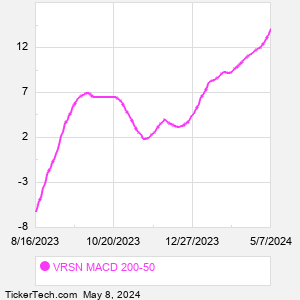
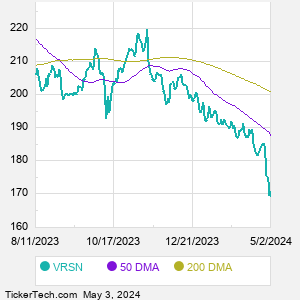
When researching a stock like Verisign, many investors are the most familiar with Fundamental Analysis — looking at a company's balance sheet, earnings, revenues, and what's happening in that company's underlying business. Investors who use Fundamental Analysis to identify good stocks to buy or sell can also benefit from VRSN Technical Analysis to help find a good entry or exit point. Technical Analysis is blind to the fundamentals and looks only at the trading data for VRSN stock — the real life supply and demand for the stock over time — and examines that data in different ways. One of those ways is to calculate a Simpe Moving Average ("SMA") by looking back a certain number of days. One of the most popular "longer look-backs" is the VRSN 200 day moving average ("VRSN 200 DMA"), while one of the most popular "shorter look-backs" is the VRSN 50 day moving average ("VRSN 50 DMA"). A chart showing both of these popular moving averages is shown on this page for Verisign. Comparing two moving averages against each other can be a useful visualization tool: by calculating the difference between the VRSN 200 DMA and the VRSN 50 DMA, we get a moving average convergence divergence indicator ("VRSN MACD"). The VRSN MACD chart, in conjunction with the chart of the moving averages, basically helps in visualizing how the moving averages are showing convergence (moving closer together), or divergence (moving farther apart). |