Verizon Communications is a holding company. Through its subsidiaries, Co. provides communications, technology, information and entertainment products and services to consumers, businesses and government entities. Co.'s Verizon Consumer Group segment's wireless and wireline products and services are available to its retail customers, as well as resellers that purchase wireless network access from it on a wholesale basis. Co.'s Verizon Business Group segment's wireless and wireline products and services are organized by the primary customer groups targeted by these offerings: Small and Medium Business, Global Enterprise, Public Sector and Other, and Wholesale.
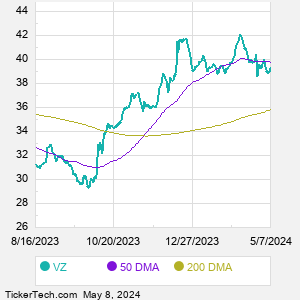
When researching a stock like Verizon Communications, many investors are the most familiar with Fundamental Analysis — looking at a company's balance sheet, earnings, revenues, and what's happening in that company's underlying business. Investors who use Fundamental Analysis to identify good stocks to buy or sell can also benefit from VZ Technical Analysis to help find a good entry or exit point. Technical Analysis is blind to the fundamentals and looks only at the trading data for VZ stock — the real life supply and demand for the stock over time — and examines that data in different ways. One of those ways is to calculate a Simpe Moving Average ("SMA") by looking back a certain number of days. One of the most popular "longer look-backs" is the VZ 200 day moving average ("VZ 200 DMA"), while one of the most popular "shorter look-backs" is the VZ 50 day moving average ("VZ 50 DMA"). A chart showing both of these popular moving averages is shown on this page for Verizon Communications. Comparing two moving averages against each other can be a useful visualization tool: by calculating the difference between the VZ 200 DMA and the VZ 50 DMA, we get a moving average convergence divergence indicator ("VZ MACD"). The VZ MACD chart, in conjunction with the chart of the moving averages, basically helps in visualizing how the moving averages are showing convergence (moving closer together), or divergence (moving farther apart). |