Whirlpool is a home appliance company. Co. manufactures and markets a line of home appliances and related products. Co.'s principal products are laundry appliances (including commercial laundry appliances), refrigerators and freezers, cooking appliances, and dishwashers. Additionally, Co. has a portfolio of small domestic appliances, including the KitchenAid stand mixer. Co. manufactures and markets products under brand names such as such as Whirlpool, KitchenAid, Maytag, Consul, Brastemp, Amana, Bauknecht, JennAir, Indesit, Yummly and Hotpoint. Co.'s operating and reportable segments consist of North America, Europe, Middle East and Africa, Latin America and Asia.
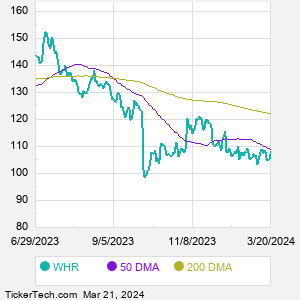
When researching a stock like Whirlpool, many investors are the most familiar with Fundamental Analysis — looking at a company's balance sheet, earnings, revenues, and what's happening in that company's underlying business. Investors who use Fundamental Analysis to identify good stocks to buy or sell can also benefit from WHR Technical Analysis to help find a good entry or exit point. Technical Analysis is blind to the fundamentals and looks only at the trading data for WHR stock — the real life supply and demand for the stock over time — and examines that data in different ways. One of those ways is to calculate a Simpe Moving Average ("SMA") by looking back a certain number of days. One of the most popular "longer look-backs" is the WHR 200 day moving average ("WHR 200 DMA"), while one of the most popular "shorter look-backs" is the WHR 50 day moving average ("WHR 50 DMA"). A chart showing both of these popular moving averages is shown on this page for Whirlpool. Comparing two moving averages against each other can be a useful visualization tool: by calculating the difference between the WHR 200 DMA and the WHR 50 DMA, we get a moving average convergence divergence indicator ("WHR MACD"). The WHR MACD chart, in conjunction with the chart of the moving averages, basically helps in visualizing how the moving averages are showing convergence (moving closer together), or divergence (moving farther apart). |