Western Union is a holding company. Through its subsidiaries, Co. is engaged in global money movement and payment services, providing people and businesses with ways to send money and make payments around the world. Co.'s segments are: Consumer-to-Consumer, which focuses on money transfers from one consumer to another; and Business Solutions, which facilitates payment and foreign exchange solutions, primarily cross-border, cross-currency transactions, for small and medium size enterprises, and other organizations and individuals. Co.'s remaining businesses and services, which consist of its bill payment services in Argentina and the U.S. and money order services, are included in Other.
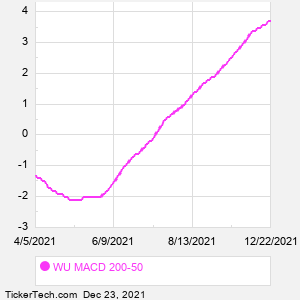
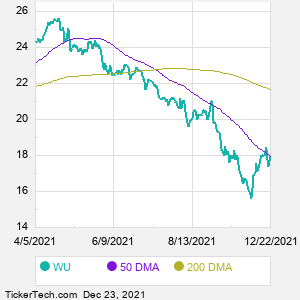
When researching a stock like Western Union, many investors are the most familiar with Fundamental Analysis — looking at a company's balance sheet, earnings, revenues, and what's happening in that company's underlying business. Investors who use Fundamental Analysis to identify good stocks to buy or sell can also benefit from WU Technical Analysis to help find a good entry or exit point. Technical Analysis is blind to the fundamentals and looks only at the trading data for WU stock — the real life supply and demand for the stock over time — and examines that data in different ways. One of those ways is to calculate a Simpe Moving Average ("SMA") by looking back a certain number of days. One of the most popular "longer look-backs" is the WU 200 day moving average ("WU 200 DMA"), while one of the most popular "shorter look-backs" is the WU 50 day moving average ("WU 50 DMA"). A chart showing both of these popular moving averages is shown on this page for Western Union. Comparing two moving averages against each other can be a useful visualization tool: by calculating the difference between the WU 200 DMA and the WU 50 DMA, we get a moving average convergence divergence indicator ("WU MACD"). The WU MACD chart, in conjunction with the chart of the moving averages, basically helps in visualizing how the moving averages are showing convergence (moving closer together), or divergence (moving farther apart). |