Yum! Brands franchises or operates a system of restaurants in various countries and territories under the concepts of KFC, Taco Bell, Pizza Hut and The Habit Burger Grill (collectively, the Concepts). Through its Concepts, Co. develops, operates or franchises a system of both conventional and non-conventional restaurants. Co.'s conventional restaurants feature dine-in, carryout and, in some instances, drive-thru service. Non-conventional units include express units which have a more limited menu and operate in non-conventional locations like malls, airports and subways. Co.'s segments are: the KFC Division; the Taco Bell Division; the Pizza Hut Division; and The Habit Burger Grill Division.
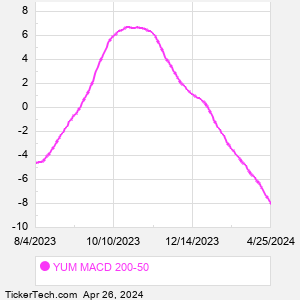
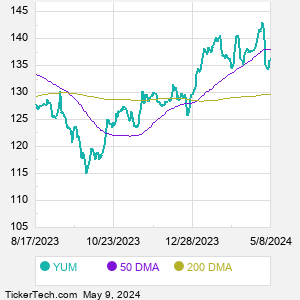
When researching a stock like Yum! Brands, many investors are the most familiar with Fundamental Analysis — looking at a company's balance sheet, earnings, revenues, and what's happening in that company's underlying business. Investors who use Fundamental Analysis to identify good stocks to buy or sell can also benefit from YUM Technical Analysis to help find a good entry or exit point. Technical Analysis is blind to the fundamentals and looks only at the trading data for YUM stock — the real life supply and demand for the stock over time — and examines that data in different ways. One of those ways is to calculate a Simpe Moving Average ("SMA") by looking back a certain number of days. One of the most popular "longer look-backs" is the YUM 200 day moving average ("YUM 200 DMA"), while one of the most popular "shorter look-backs" is the YUM 50 day moving average ("YUM 50 DMA"). A chart showing both of these popular moving averages is shown on this page for Yum! Brands. Comparing two moving averages against each other can be a useful visualization tool: by calculating the difference between the YUM 200 DMA and the YUM 50 DMA, we get a moving average convergence divergence indicator ("YUM MACD"). The YUM MACD chart, in conjunction with the chart of the moving averages, basically helps in visualizing how the moving averages are showing convergence (moving closer together), or divergence (moving farther apart). |




 Free YUM Email Alerts:


 Video: Technical Analysis