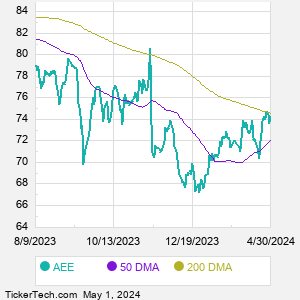
AEE MACD: Ameren MACD Chart

AEE MACD is -4.56 with data shown as of 7/13/2026, with Ameren trading at 113.43. Our MACD calculation compares 200-day versus 50-day moving averages to help investors identify changes in momentum, trend direction, and possible bullish or bearish signal-line crossovers. MACD readings are commonly reviewed alongside price trends, volume, RSI, and moving averages to evaluate technical momentum.

AEE MACD: Ameren MACD Chart


As of date:7/13/2026
AEE stock price:113.43
AEE 50 DMA:110.05
AEE 200 DMA:105.49
AEE MACD (200-50):-4.56

Also see:
AEE Market Cap History
AEE Shares Outstanding History
AEE YTD Return
AEE DMA
AEE RSI
AEE Technical Analysis

Brookfield Renewable Enters Oversold Territory as RSI Falls Below 30
1 hour, 16 minutes ago


Destiny Tech100 (DXYZ) Enters Oversold Territory as RSI Falls Below 30
1 hour, 22 minutes ago


KraneShares MSCI China Clean Technology ETF Enters Oversold Territory as RSI Falls Below 30
1 hour, 22 minutes ago


Shares of BEPC Now Oversold
1 hour, 51 minutes ago


OR Royalties Stock Enters Oversold Territory as RSI Drops Below 30
1 hour, 52 minutes ago


Dolby Laboratories Stock Enters Oversold Territory as Dividend Yield Improves
1 hour, 52 minutes ago


Apollo Series A Preferred Yield Tops 5.5% as Shares Trade Above Liquidation Preference
3 hours, 2 minutes ago


Invesco NASDAQ 100 ETF (QQQM) Draws Strong Inflows as Assets Track Nasdaq-100 Demand
5 hours, 32 minutes ago


Shift4 Payments Preferred Stock Ex-Dividend Date Nears as FOUR.PRA Offers Elevated Yield
5 hours, 34 minutes ago


Ag Growth International Stock Enters Oversold Territory as RSI Falls Below 30
Friday, July 10, 4:46 PM


Simplify Multi-QIS Alternative ETF Enters Oversold Territory as Shares Test 52-Week Low
Friday, July 10, 4:14 PM


EQT Stock Enters Oversold Territory as RSI Falls Below 30
Friday, July 10, 4:10 PM


EOSE Stock Hits New 52-Week Low as Recent Insider Buying Draws Attention
Friday, July 10, 2:03 PM


ICL Group Stock Enters Oversold Territory as RSI Falls Below 30
Thursday, July 9, 5:03 PM


Chunghwa Telecom Stock Enters Oversold Territory as Yield Rises
Thursday, July 9, 5:00 PM


More Technical Analysis News

AEE MACDAEE DMA
Ameren Corporation is a public utility holding company. Co. operates through four segments: Ameren Missouri, Ameren Illinois Electric Distribution, Ameren Illinois Natural Gas, and Ameren Transmission. The Ameren Missouri segment includes all of the operations of Ameren Missouri. Ameren Missouri operates a rate-regulated electric generation, transmission, and distribution business and a rate-regulated natural gas distribution business in Missouri. The Ameren Illinois Electric Distribution segment consists of the electric distribution business of Ameren Illinois. The Ameren Illinois Natural Gas segment consists of the natural gas business of Ameren Illinois.

When researching a stock like Ameren, many investors are the most familiar with Fundamental Analysis — looking at a company's balance sheet, earnings, revenues, and what's happening in that company's underlying business. Investors who use Fundamental Analysis to identify good stocks to buy or sell can also benefit from AEE Technical Analysis to help find a good entry or exit point. Technical Analysis is blind to the fundamentals and looks only at the trading data for AEE stock — the real life supply and demand for the stock over time — and examines that data in different ways. One of those ways is to calculate a Simpe Moving Average ("SMA") by looking back a certain number of days. One of the most popular "longer look-backs" is the AEE 200 day moving average ("AEE 200 DMA"), while one of the most popular "shorter look-backs" is the AEE 50 day moving average ("AEE 50 DMA"). A chart showing both of these popular moving averages is shown on this page for Ameren. Comparing two moving averages against each other can be a useful visualization tool: by calculating the difference between the AEE 200 DMA and the AEE 50 DMA, we get a moving average convergence divergence indicator ("AEE MACD"). The AEE MACD chart, in conjunction with the chart of the moving averages, basically helps in visualizing how the moving averages are showing convergence (moving closer together), or divergence (moving farther apart).
10 Most Oversold S&P 500 Stocks
10 Most Overbought S&P 500 Stocks

10 ETFs With Stocks Insiders Are Buying
10 ETFs With Most Upside To Targets
The DividendRank Top 25
Warren Buffett Dividend Stocks
10 Cheap Dividend Stocks Under $10
10 Top DividendRank'ed Energy Stocks
The 10 Highest Yielding Preferred Stocks
The 15 Most Active S&P Call & Put Options
Quotes delayed 20 minutes

Email EnvelopeFree AEE Email Alerts:
Get Dividend Alerts
Get SEC Filing Alerts
Video: Technical Analysis
Ameren (AEE) is categorized under the Utilities sector; to help you further research MACD, below are some other companies in the same sector:

AEP MACD
AES MACD
ATO MACD
AWK MACD
CEG MACD
CMS MACD
CNP MACD
D MACD
DTE MACD
DUK MACD
More Utilities companies »
 

AEE MACD: Ameren MACD Chart | www.StockMACD.com | Copyright © 2019 - 2026, All Rights Reserved

Nothing in StockMACD.com is intended to be investment advice, nor does it represent the opinion of, counsel from, or recommendations by BNK Invest Inc. or any of its affiliates, subsidiaries or partners. None of the information contained herein constitutes a recommendation that any particular security, portfolio, transaction, or investment strategy is suitable for any specific person. All viewers agree that under no circumstances will BNK Invest, Inc,. its subsidiaries, partners, officers, employees, affiliates, or agents be held liable for any loss or damage caused by your reliance on information obtained. By visiting, using or viewing this site, you agree to the following Full Disclaimer & Terms of Use and Privacy Policy. Video widget and market videos powered by Market News Video. Quote and option data delayed at least 15 minutes; stock quote data powered by Ticker Technologies, and Mergent.
X
Wait! Don't leave yet.
Want to receive our latest research absolutely free?


Click the button below for your complimentary copy of Your Early Retirement Portfolio: Dividends Up to 8.2%—Every Month—Forever.

You'll discover the details on 4 stocks and funds that pay you massive dividends as high as 8.2%.