Atmos Energy engages in the regulated natural gas distribution and pipeline and storage businesses. Co. delivers natural gas through sales and transportation arrangements to residential, commercial, public-authority and industrial customers. Co.'s operating segments are: distribution, which is comprised of its regulated natural gas distribution and related sales operations in various states; and pipeline and storage, which consists of the pipeline and storage operations of Atmos Pipeline-Texas Division (APT) and its natural gas transmission operations in Louisiana. APT provides transportation and storage services to Co.'s Mid-Tex Division and other third party local distribution companies.
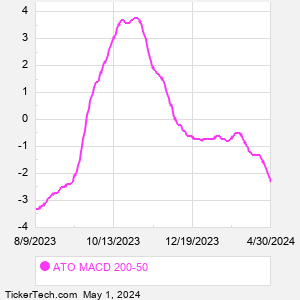
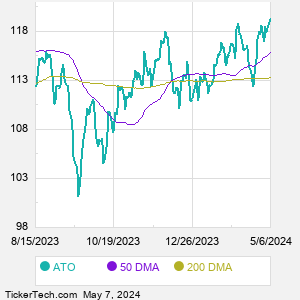
When researching a stock like Atmos Energy, many investors are the most familiar with Fundamental Analysis — looking at a company's balance sheet, earnings, revenues, and what's happening in that company's underlying business. Investors who use Fundamental Analysis to identify good stocks to buy or sell can also benefit from ATO Technical Analysis to help find a good entry or exit point. Technical Analysis is blind to the fundamentals and looks only at the trading data for ATO stock — the real life supply and demand for the stock over time — and examines that data in different ways. One of those ways is to calculate a Simpe Moving Average ("SMA") by looking back a certain number of days. One of the most popular "longer look-backs" is the ATO 200 day moving average ("ATO 200 DMA"), while one of the most popular "shorter look-backs" is the ATO 50 day moving average ("ATO 50 DMA"). A chart showing both of these popular moving averages is shown on this page for Atmos Energy. Comparing two moving averages against each other can be a useful visualization tool: by calculating the difference between the ATO 200 DMA and the ATO 50 DMA, we get a moving average convergence divergence indicator ("ATO MACD"). The ATO MACD chart, in conjunction with the chart of the moving averages, basically helps in visualizing how the moving averages are showing convergence (moving closer together), or divergence (moving farther apart). |