FirstEnergy is a public utility holding company. Through its subsidiaries, Co. is engaged in the transmission, distribution and generation of electricity. Co.'s segments include: Regulated Distribution, which distributes electricity through its utility operating companies (including Ohio Edison Company, The Cleveland Electric Illuminating Company, The Toledo Edison Company, Pennsylvania Power Company and Jersey Central Power & Light Company); and Regulated Transmission, which provides transmission infrastructure owned and operated by the Transmission Companies and certain of Co.'s utilities to transmit electricity from generation sources to distribution facilities.
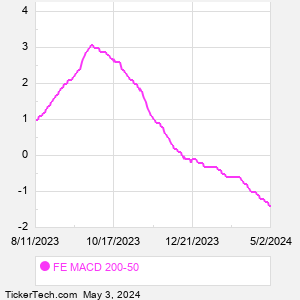
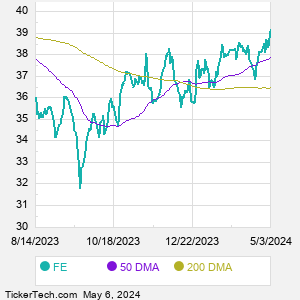
When researching a stock like FirstEnergy, many investors are the most familiar with Fundamental Analysis — looking at a company's balance sheet, earnings, revenues, and what's happening in that company's underlying business. Investors who use Fundamental Analysis to identify good stocks to buy or sell can also benefit from FE Technical Analysis to help find a good entry or exit point. Technical Analysis is blind to the fundamentals and looks only at the trading data for FE stock — the real life supply and demand for the stock over time — and examines that data in different ways. One of those ways is to calculate a Simpe Moving Average ("SMA") by looking back a certain number of days. One of the most popular "longer look-backs" is the FE 200 day moving average ("FE 200 DMA"), while one of the most popular "shorter look-backs" is the FE 50 day moving average ("FE 50 DMA"). A chart showing both of these popular moving averages is shown on this page for FirstEnergy. Comparing two moving averages against each other can be a useful visualization tool: by calculating the difference between the FE 200 DMA and the FE 50 DMA, we get a moving average convergence divergence indicator ("FE MACD"). The FE MACD chart, in conjunction with the chart of the moving averages, basically helps in visualizing how the moving averages are showing convergence (moving closer together), or divergence (moving farther apart). |