| INCY MACD Data | ||||||||||
Also see: |


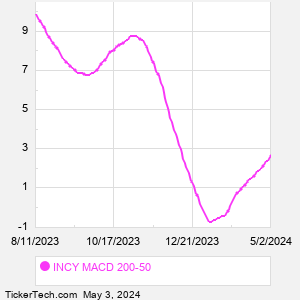
| INCY MACD Chart |
  |
| About Incyte Corporation |
| Incyte is a biopharmaceutical company focused on the discovery, development and commercialization of proprietary therapeutics. JAKAFI (ruxolitinib) is Co.'s initial product approved by the U.S. Food and Drug Administration for the treatment of adults with intermediate or high-risk myelofibrosis, for the treatment of adults with polycythemia vera who have had an inadequate response to or are intolerant of hydroxyurea, for the treatment of steroid-refractory acute graft-versus-host disease (GVHD) in adult and pediatric patients 12 years and older and for the treatment of chronic GVHD after failure of one or two lines of systemic therapy in adult and pediatric patients 12 years and older. When researching a stock like Incyte, many investors are the most familiar with Fundamental Analysis — looking at a company's balance sheet, earnings, revenues, and what's happening in that company's underlying business. Investors who use Fundamental Analysis to identify good stocks to buy or sell can also benefit from INCY Technical Analysis to help find a good entry or exit point. Technical Analysis is blind to the fundamentals and looks only at the trading data for INCY stock — the real life supply and demand for the stock over time — and examines that data in different ways. One of those ways is to calculate a Simpe Moving Average ("SMA") by looking back a certain number of days. One of the most popular "longer look-backs" is the INCY 200 day moving average ("INCY 200 DMA"), while one of the most popular "shorter look-backs" is the INCY 50 day moving average ("INCY 50 DMA"). A chart showing both of these popular moving averages is shown on this page for Incyte. Comparing two moving averages against each other can be a useful visualization tool: by calculating the difference between the INCY 200 DMA and the INCY 50 DMA, we get a moving average convergence divergence indicator ("INCY MACD"). The INCY MACD chart, in conjunction with the chart of the moving averages, basically helps in visualizing how the moving averages are showing convergence (moving closer together), or divergence (moving farther apart). |
| INCY Current Stock Quote |
Get Dividend Alerts Get SEC Filing Alerts |
| INCY Stock Price Chart |
| Video: Technical Analysis | |
|
| INCY MACD Peers |
| Incyte (INCY) is categorized under the Healthcare sector; to help you further research MACD, below are some other companies in the same sector:
IQV MACD |