Mosaic is a producer and marketer of concentrated phosphate and potash crop nutrients. Co.'s reportable business segments: Phosphates, which owns and operates mines and production facilities in Florida that produce concentrated phosphate crop nutrients and phosphate-based animal feed ingredients, and processing plants in Louisiana that produce concentrated phosphate crop nutrients; Potash, which mines and processes potash in Canada and the U.S. and sells potash in North America and internationally; and Mosaic Fertilizantes, which produces and sells concentrated phosphates crop nutrients, phosphate-based animal feed ingredients and potash fertilizer.
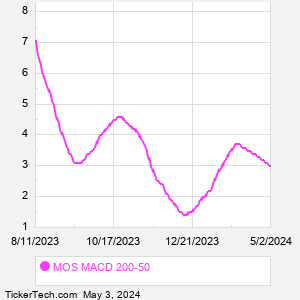
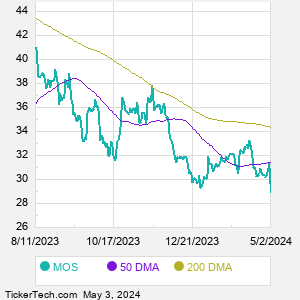
When researching a stock like Mosaic, many investors are the most familiar with Fundamental Analysis — looking at a company's balance sheet, earnings, revenues, and what's happening in that company's underlying business. Investors who use Fundamental Analysis to identify good stocks to buy or sell can also benefit from MOS Technical Analysis to help find a good entry or exit point. Technical Analysis is blind to the fundamentals and looks only at the trading data for MOS stock — the real life supply and demand for the stock over time — and examines that data in different ways. One of those ways is to calculate a Simpe Moving Average ("SMA") by looking back a certain number of days. One of the most popular "longer look-backs" is the MOS 200 day moving average ("MOS 200 DMA"), while one of the most popular "shorter look-backs" is the MOS 50 day moving average ("MOS 50 DMA"). A chart showing both of these popular moving averages is shown on this page for Mosaic. Comparing two moving averages against each other can be a useful visualization tool: by calculating the difference between the MOS 200 DMA and the MOS 50 DMA, we get a moving average convergence divergence indicator ("MOS MACD"). The MOS MACD chart, in conjunction with the chart of the moving averages, basically helps in visualizing how the moving averages are showing convergence (moving closer together), or divergence (moving farther apart). |