PayPal Holdings is a technology platform that enables digital payments on behalf of merchants and consumers worldwide. Co.'s payment solutions enable its customers to send and receive payments. Co. operates a global, two-sided network at scale that connects merchants and consumers with various active accounts across various markets. Co. helps merchants and consumers connect, transact, and complete payments, whether they are online or in person. Co. provides proprietary payment solutions accepted by merchants that enable the completion of payments on its payments platform on behalf of its customers. Co. enables consumers to exchange funds with merchants using a variety of funding sources.
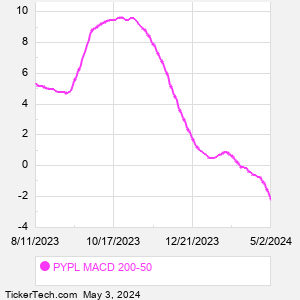
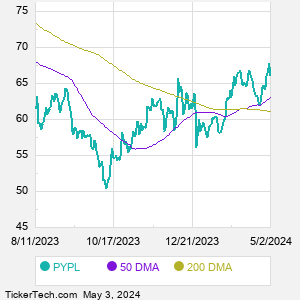
When researching a stock like PayPal Holdings, many investors are the most familiar with Fundamental Analysis — looking at a company's balance sheet, earnings, revenues, and what's happening in that company's underlying business. Investors who use Fundamental Analysis to identify good stocks to buy or sell can also benefit from PYPL Technical Analysis to help find a good entry or exit point. Technical Analysis is blind to the fundamentals and looks only at the trading data for PYPL stock — the real life supply and demand for the stock over time — and examines that data in different ways. One of those ways is to calculate a Simpe Moving Average ("SMA") by looking back a certain number of days. One of the most popular "longer look-backs" is the PYPL 200 day moving average ("PYPL 200 DMA"), while one of the most popular "shorter look-backs" is the PYPL 50 day moving average ("PYPL 50 DMA"). A chart showing both of these popular moving averages is shown on this page for PayPal Holdings. Comparing two moving averages against each other can be a useful visualization tool: by calculating the difference between the PYPL 200 DMA and the PYPL 50 DMA, we get a moving average convergence divergence indicator ("PYPL MACD"). The PYPL MACD chart, in conjunction with the chart of the moving averages, basically helps in visualizing how the moving averages are showing convergence (moving closer together), or divergence (moving farther apart). |