Simon Property Group operates as a self-administered and self-managed real estate investment trust. Simon Property Group, L.P. is Co.'s majority-owned Delaware partnership subsidiary that owns all of its real estate properties and other assets. Co. owns, develops and manages shopping, dining, entertainment and mixed-use destinations. Co. owns or holds an interest in various income-producing properties in the U.S., which consisted of malls, Premium Outlets, Mills, lifestyle centers, and other retail properties in various states and Puerto Rico. Internationally, Co. has ownership interests in Premium Outlets and Designer Outlet properties primarily located in Asia, Europe and Canada.
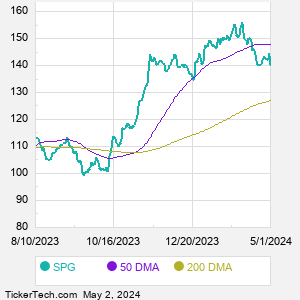
When researching a stock like Simon Property Group, many investors are the most familiar with Fundamental Analysis — looking at a company's balance sheet, earnings, revenues, and what's happening in that company's underlying business. Investors who use Fundamental Analysis to identify good stocks to buy or sell can also benefit from SPG Technical Analysis to help find a good entry or exit point. Technical Analysis is blind to the fundamentals and looks only at the trading data for SPG stock — the real life supply and demand for the stock over time — and examines that data in different ways. One of those ways is to calculate a Simpe Moving Average ("SMA") by looking back a certain number of days. One of the most popular "longer look-backs" is the SPG 200 day moving average ("SPG 200 DMA"), while one of the most popular "shorter look-backs" is the SPG 50 day moving average ("SPG 50 DMA"). A chart showing both of these popular moving averages is shown on this page for Simon Property Group. Comparing two moving averages against each other can be a useful visualization tool: by calculating the difference between the SPG 200 DMA and the SPG 50 DMA, we get a moving average convergence divergence indicator ("SPG MACD"). The SPG MACD chart, in conjunction with the chart of the moving averages, basically helps in visualizing how the moving averages are showing convergence (moving closer together), or divergence (moving farther apart). |