Ventas is a real estate investment trust with a portfolio of senior housing communities, medical office buildings (MOBs), life science, research and innovation centers, hospitals and other healthcare facilities. Co.'s segments are: triple-net leased properties, which invests in and owns senior housing and healthcare properties and leases to healthcare operating companies under triple-net or absolute-net leases; senior housing operating portfolio, which invests in senior housing communities and engages independent managers to operate and manage those communities; and office operations, which acquires, owns, develops, leases and manages MOBs and life science, research and innovation centers.
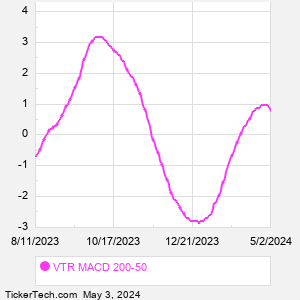
When researching a stock like Ventas, many investors are the most familiar with Fundamental Analysis — looking at a company's balance sheet, earnings, revenues, and what's happening in that company's underlying business. Investors who use Fundamental Analysis to identify good stocks to buy or sell can also benefit from VTR Technical Analysis to help find a good entry or exit point. Technical Analysis is blind to the fundamentals and looks only at the trading data for VTR stock — the real life supply and demand for the stock over time — and examines that data in different ways. One of those ways is to calculate a Simpe Moving Average ("SMA") by looking back a certain number of days. One of the most popular "longer look-backs" is the VTR 200 day moving average ("VTR 200 DMA"), while one of the most popular "shorter look-backs" is the VTR 50 day moving average ("VTR 50 DMA"). A chart showing both of these popular moving averages is shown on this page for Ventas. Comparing two moving averages against each other can be a useful visualization tool: by calculating the difference between the VTR 200 DMA and the VTR 50 DMA, we get a moving average convergence divergence indicator ("VTR MACD"). The VTR MACD chart, in conjunction with the chart of the moving averages, basically helps in visualizing how the moving averages are showing convergence (moving closer together), or divergence (moving farther apart). |