Waters is a holding company. Through its subsidiaries, Co. is a specialty measurement company. Co. primarily designs, manufactures, sells and services high performance liquid chromatography, ultra performance liquid chromatography and mass spectrometry technology systems and support products, including chromatography columns, other consumable products and post-warranty service plans. In addition, Co. designs, manufactures, sells and services thermal analysis, rheometry and calorimetry instruments through its Instruments™ product line. Co. is also a developer and supplier of software-based products that interface with its instruments, as well as other manufacturers' instruments.
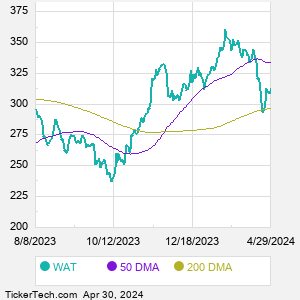
When researching a stock like Waters, many investors are the most familiar with Fundamental Analysis — looking at a company's balance sheet, earnings, revenues, and what's happening in that company's underlying business. Investors who use Fundamental Analysis to identify good stocks to buy or sell can also benefit from WAT Technical Analysis to help find a good entry or exit point. Technical Analysis is blind to the fundamentals and looks only at the trading data for WAT stock — the real life supply and demand for the stock over time — and examines that data in different ways. One of those ways is to calculate a Simpe Moving Average ("SMA") by looking back a certain number of days. One of the most popular "longer look-backs" is the WAT 200 day moving average ("WAT 200 DMA"), while one of the most popular "shorter look-backs" is the WAT 50 day moving average ("WAT 50 DMA"). A chart showing both of these popular moving averages is shown on this page for Waters. Comparing two moving averages against each other can be a useful visualization tool: by calculating the difference between the WAT 200 DMA and the WAT 50 DMA, we get a moving average convergence divergence indicator ("WAT MACD"). The WAT MACD chart, in conjunction with the chart of the moving averages, basically helps in visualizing how the moving averages are showing convergence (moving closer together), or divergence (moving farther apart). |