Accenture is a services company. Co.'s services include: Strategy and Consulting, which works with C-suite executives and boards of organizations, helping them formulate their strategy; Technology, which includes services and solutions such as cloud, systems integration and application management, and infrastructure services; Operations, which operates business processes on behalf of clients for specific enterprise functions; Industry X, which combines its digital capabilities with engineering and manufacturing capabilities; and Song, which includes growth, product and design, technology and platforms, creative, media and marketing strategy, and campaign, content and channel orchestration.
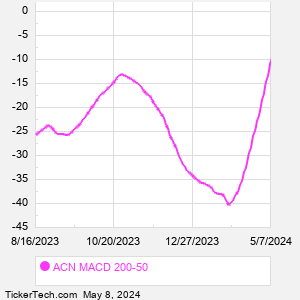
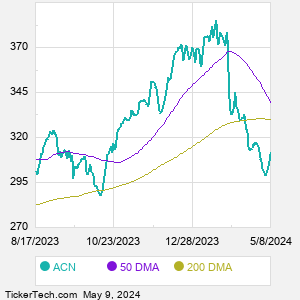
When researching a stock like Accenture, many investors are the most familiar with Fundamental Analysis — looking at a company's balance sheet, earnings, revenues, and what's happening in that company's underlying business. Investors who use Fundamental Analysis to identify good stocks to buy or sell can also benefit from ACN Technical Analysis to help find a good entry or exit point. Technical Analysis is blind to the fundamentals and looks only at the trading data for ACN stock — the real life supply and demand for the stock over time — and examines that data in different ways. One of those ways is to calculate a Simpe Moving Average ("SMA") by looking back a certain number of days. One of the most popular "longer look-backs" is the ACN 200 day moving average ("ACN 200 DMA"), while one of the most popular "shorter look-backs" is the ACN 50 day moving average ("ACN 50 DMA"). A chart showing both of these popular moving averages is shown on this page for Accenture. Comparing two moving averages against each other can be a useful visualization tool: by calculating the difference between the ACN 200 DMA and the ACN 50 DMA, we get a moving average convergence divergence indicator ("ACN MACD"). The ACN MACD chart, in conjunction with the chart of the moving averages, basically helps in visualizing how the moving averages are showing convergence (moving closer together), or divergence (moving farther apart). |