Blackstone is a holding company. Through its subsidiaries, Co. is an investment firm. Co.'s asset management businesses include investment vehicles.Co.'s business is organized into four segments: Real Estate, which comprises its management of opportunistic real estate funds, Core+ real estate funds, high-yield real estate debt funds, liquid real estate debt funds; Private Equity, which includes its corporate private equity business; Hedge Fund Solutions, which include GP Stakes Business; and Credit and Insurance, which consists principally of Blackstone Credit, which is organized into two overarching strategies: private credit and liquid credit.
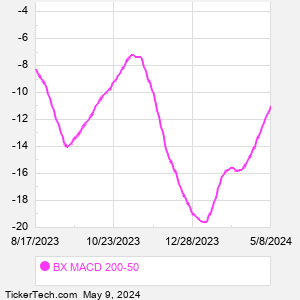
When researching a stock like Blackstone, many investors are the most familiar with Fundamental Analysis — looking at a company's balance sheet, earnings, revenues, and what's happening in that company's underlying business. Investors who use Fundamental Analysis to identify good stocks to buy or sell can also benefit from BX Technical Analysis to help find a good entry or exit point. Technical Analysis is blind to the fundamentals and looks only at the trading data for BX stock — the real life supply and demand for the stock over time — and examines that data in different ways. One of those ways is to calculate a Simpe Moving Average ("SMA") by looking back a certain number of days. One of the most popular "longer look-backs" is the BX 200 day moving average ("BX 200 DMA"), while one of the most popular "shorter look-backs" is the BX 50 day moving average ("BX 50 DMA"). A chart showing both of these popular moving averages is shown on this page for Blackstone. Comparing two moving averages against each other can be a useful visualization tool: by calculating the difference between the BX 200 DMA and the BX 50 DMA, we get a moving average convergence divergence indicator ("BX MACD"). The BX MACD chart, in conjunction with the chart of the moving averages, basically helps in visualizing how the moving averages are showing convergence (moving closer together), or divergence (moving farther apart). |