CME Group is a holding company. Through its subsidiaries, Co. provides market participants the ability to manage risk within and across multiple asset classes, by trading futures, options, cash and over-the-counter products. Co. provides price discovery and referential pricing information through its market data in a variety of formats, including real time, historical and derived data for customers in both listed and cash products. Co. also provides research and analytics tools to provide customers with market education resources. Co. exchanges provide a range of global benchmark products across interest rates, equity indexes, foreign exchange, agricultural commodities, energy and metals.
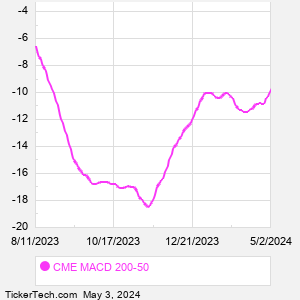
When researching a stock like CME Group, many investors are the most familiar with Fundamental Analysis — looking at a company's balance sheet, earnings, revenues, and what's happening in that company's underlying business. Investors who use Fundamental Analysis to identify good stocks to buy or sell can also benefit from CME Technical Analysis to help find a good entry or exit point. Technical Analysis is blind to the fundamentals and looks only at the trading data for CME stock — the real life supply and demand for the stock over time — and examines that data in different ways. One of those ways is to calculate a Simpe Moving Average ("SMA") by looking back a certain number of days. One of the most popular "longer look-backs" is the CME 200 day moving average ("CME 200 DMA"), while one of the most popular "shorter look-backs" is the CME 50 day moving average ("CME 50 DMA"). A chart showing both of these popular moving averages is shown on this page for CME Group. Comparing two moving averages against each other can be a useful visualization tool: by calculating the difference between the CME 200 DMA and the CME 50 DMA, we get a moving average convergence divergence indicator ("CME MACD"). The CME MACD chart, in conjunction with the chart of the moving averages, basically helps in visualizing how the moving averages are showing convergence (moving closer together), or divergence (moving farther apart). |