Fair Isaac is an applied analytics company. Co.'s Scores segment includes its business-to-business scoring solutions and services and its business-to-consumer scoring solutions, including its myFICO.com subscription offerings. Co.'s Software segment includes pre-configured analytic and decision management solutions designed for business need or process, such as account origination, customer management, customer engagement, fraud detection, financial crimes compliance, and marketing, as well as associated services. The Software segment also includes FICO® Platform, a modular software offering designed to support analytic and decision use cases, as well as analytic and decisioning software.
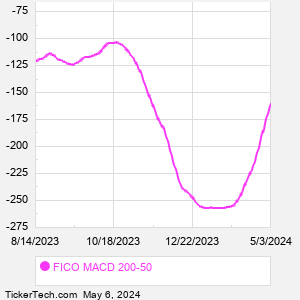
When researching a stock like Fair Isaac, many investors are the most familiar with Fundamental Analysis — looking at a company's balance sheet, earnings, revenues, and what's happening in that company's underlying business. Investors who use Fundamental Analysis to identify good stocks to buy or sell can also benefit from FICO Technical Analysis to help find a good entry or exit point. Technical Analysis is blind to the fundamentals and looks only at the trading data for FICO stock — the real life supply and demand for the stock over time — and examines that data in different ways. One of those ways is to calculate a Simpe Moving Average ("SMA") by looking back a certain number of days. One of the most popular "longer look-backs" is the FICO 200 day moving average ("FICO 200 DMA"), while one of the most popular "shorter look-backs" is the FICO 50 day moving average ("FICO 50 DMA"). A chart showing both of these popular moving averages is shown on this page for Fair Isaac. Comparing two moving averages against each other can be a useful visualization tool: by calculating the difference between the FICO 200 DMA and the FICO 50 DMA, we get a moving average convergence divergence indicator ("FICO MACD"). The FICO MACD chart, in conjunction with the chart of the moving averages, basically helps in visualizing how the moving averages are showing convergence (moving closer together), or divergence (moving farther apart). |