Hubbell is a manufacturer of electrical products and utility solutions. Co.'s Electrical Solutions segment sells stock and custom products including application wiring device products, electrical products, connector and grounding products, and lighting fixtures, as well as other electrical equipment. Co.'s Utility Solutions segment consists of businesses that design, manufacture, and sell a variety of electrical distribution, transmission, substation, and telecommunications products, which support applications In Front of the Meter. This includes utility transmission & distribution components such as arresters, insulators, connectors, anchors, bushings, and enclosures.
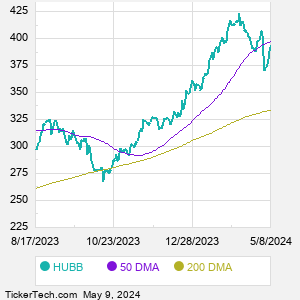
When researching a stock like Hubbell, many investors are the most familiar with Fundamental Analysis — looking at a company's balance sheet, earnings, revenues, and what's happening in that company's underlying business. Investors who use Fundamental Analysis to identify good stocks to buy or sell can also benefit from HUBB Technical Analysis to help find a good entry or exit point. Technical Analysis is blind to the fundamentals and looks only at the trading data for HUBB stock — the real life supply and demand for the stock over time — and examines that data in different ways. One of those ways is to calculate a Simpe Moving Average ("SMA") by looking back a certain number of days. One of the most popular "longer look-backs" is the HUBB 200 day moving average ("HUBB 200 DMA"), while one of the most popular "shorter look-backs" is the HUBB 50 day moving average ("HUBB 50 DMA"). A chart showing both of these popular moving averages is shown on this page for Hubbell. Comparing two moving averages against each other can be a useful visualization tool: by calculating the difference between the HUBB 200 DMA and the HUBB 50 DMA, we get a moving average convergence divergence indicator ("HUBB MACD"). The HUBB MACD chart, in conjunction with the chart of the moving averages, basically helps in visualizing how the moving averages are showing convergence (moving closer together), or divergence (moving farther apart). |