Netflix provides entertainment services with paid memberships in various countries engaging in TV series, films and games across a variety of genres and languages. Members can play, pause and resume to watch as much as they want, anytime, anywhere, and can change their plans at any time. Co. provides a variety of streaming membership plans, the price of which varies by country and the features of the plan. Co.'s membership growth exhibits a seasonal pattern that reflects variations when consumers buy internet-connected screens and when they tend to increase their viewing.
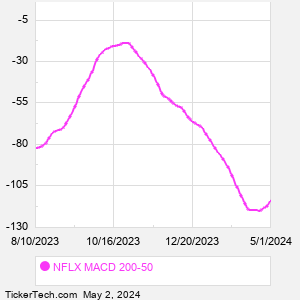
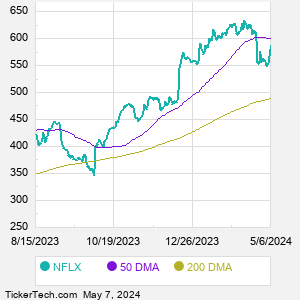
When researching a stock like Netflix, many investors are the most familiar with Fundamental Analysis — looking at a company's balance sheet, earnings, revenues, and what's happening in that company's underlying business. Investors who use Fundamental Analysis to identify good stocks to buy or sell can also benefit from NFLX Technical Analysis to help find a good entry or exit point. Technical Analysis is blind to the fundamentals and looks only at the trading data for NFLX stock — the real life supply and demand for the stock over time — and examines that data in different ways. One of those ways is to calculate a Simpe Moving Average ("SMA") by looking back a certain number of days. One of the most popular "longer look-backs" is the NFLX 200 day moving average ("NFLX 200 DMA"), while one of the most popular "shorter look-backs" is the NFLX 50 day moving average ("NFLX 50 DMA"). A chart showing both of these popular moving averages is shown on this page for Netflix. Comparing two moving averages against each other can be a useful visualization tool: by calculating the difference between the NFLX 200 DMA and the NFLX 50 DMA, we get a moving average convergence divergence indicator ("NFLX MACD"). The NFLX MACD chart, in conjunction with the chart of the moving averages, basically helps in visualizing how the moving averages are showing convergence (moving closer together), or divergence (moving farther apart). |