Procter & Gamble is focused on providing consumer packaged goods. Co.'s products are sold through mass merchandisers, e-commerce channels, grocery stores, membership club stores, drug stores, department stores, distributors, wholesalers, and pharmacies, among others. Co.'s reportable segments are: Beauty, which includes hair care and skin and personal care products; Grooming, which includes grooming products and appliances; Health Care, which includes oral care and personal health care products; Fabric and Home Care, which includes fabric care and home care products; and Baby, Feminine and Family Care, which includes baby care, feminine care and family care products
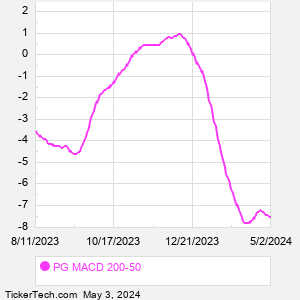
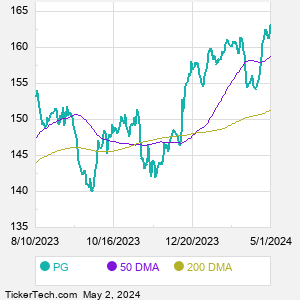
When researching a stock like Procter and Gamble, many investors are the most familiar with Fundamental Analysis — looking at a company's balance sheet, earnings, revenues, and what's happening in that company's underlying business. Investors who use Fundamental Analysis to identify good stocks to buy or sell can also benefit from PG Technical Analysis to help find a good entry or exit point. Technical Analysis is blind to the fundamentals and looks only at the trading data for PG stock — the real life supply and demand for the stock over time — and examines that data in different ways. One of those ways is to calculate a Simpe Moving Average ("SMA") by looking back a certain number of days. One of the most popular "longer look-backs" is the PG 200 day moving average ("PG 200 DMA"), while one of the most popular "shorter look-backs" is the PG 50 day moving average ("PG 50 DMA"). A chart showing both of these popular moving averages is shown on this page for Procter and Gamble. Comparing two moving averages against each other can be a useful visualization tool: by calculating the difference between the PG 200 DMA and the PG 50 DMA, we get a moving average convergence divergence indicator ("PG MACD"). The PG MACD chart, in conjunction with the chart of the moving averages, basically helps in visualizing how the moving averages are showing convergence (moving closer together), or divergence (moving farther apart). |