Bio-Techne develops, manufactures and sells life science reagents, instruments and services for the research, diagnostics and bioprocessing markets. Co.'s Protein Sciences segment develops and manufactures biological reagents used in various aspects of life science research, diagnostics and cell and gene therapy. Co.'s Diagnostics and Genomics segment develops and manufactures diagnostic products, including controls, calibrators, and diagnostic assays for the regulated diagnostics market, exosome-based molecular diagnostic assays, tissue-based in-situ hybridization assays for spatial genomic and tissue biopsy analysis, and genetic and oncology kits for research and clinical applications.
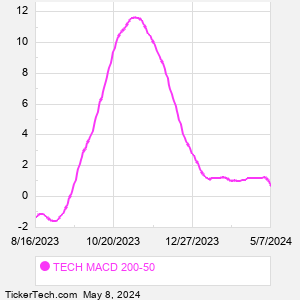
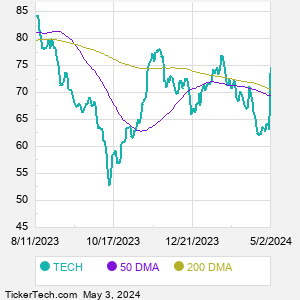
When researching a stock like Bio-Techne, many investors are the most familiar with Fundamental Analysis — looking at a company's balance sheet, earnings, revenues, and what's happening in that company's underlying business. Investors who use Fundamental Analysis to identify good stocks to buy or sell can also benefit from TECH Technical Analysis to help find a good entry or exit point. Technical Analysis is blind to the fundamentals and looks only at the trading data for TECH stock — the real life supply and demand for the stock over time — and examines that data in different ways. One of those ways is to calculate a Simpe Moving Average ("SMA") by looking back a certain number of days. One of the most popular "longer look-backs" is the TECH 200 day moving average ("TECH 200 DMA"), while one of the most popular "shorter look-backs" is the TECH 50 day moving average ("TECH 50 DMA"). A chart showing both of these popular moving averages is shown on this page for Bio-Techne. Comparing two moving averages against each other can be a useful visualization tool: by calculating the difference between the TECH 200 DMA and the TECH 50 DMA, we get a moving average convergence divergence indicator ("TECH MACD"). The TECH MACD chart, in conjunction with the chart of the moving averages, basically helps in visualizing how the moving averages are showing convergence (moving closer together), or divergence (moving farther apart). |