Bank of New York Mellon divides its businesses into two business segments, Investment Services and Investment and Wealth Management. Co. also has an Other segment, which includes the leasing portfolio, corporate treasury activities, derivatives and other trading activity, corporate and bank-owned life insurance, renewable energy and other corporate investments and certain business exits. Co.'s two principal U.S. banking subsidiaries engage in trust and custody activities, investment management services, banking services and various securities-related activities. Co.'s two principal U.S. banking subsidiaries are: The Bank of New York Mellon and BNY Mellon, National Association.
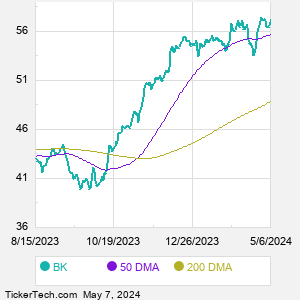
When researching a stock like Bank of York Mellon, many investors are the most familiar with Fundamental Analysis — looking at a company's balance sheet, earnings, revenues, and what's happening in that company's underlying business. Investors who use Fundamental Analysis to identify good stocks to buy or sell can also benefit from BK Technical Analysis to help find a good entry or exit point. Technical Analysis is blind to the fundamentals and looks only at the trading data for BK stock — the real life supply and demand for the stock over time — and examines that data in different ways. One of those ways is to calculate a Simpe Moving Average ("SMA") by looking back a certain number of days. One of the most popular "longer look-backs" is the BK 200 day moving average ("BK 200 DMA"), while one of the most popular "shorter look-backs" is the BK 50 day moving average ("BK 50 DMA"). A chart showing both of these popular moving averages is shown on this page for Bank of York Mellon. Comparing two moving averages against each other can be a useful visualization tool: by calculating the difference between the BK 200 DMA and the BK 50 DMA, we get a moving average convergence divergence indicator ("BK MACD"). The BK MACD chart, in conjunction with the chart of the moving averages, basically helps in visualizing how the moving averages are showing convergence (moving closer together), or divergence (moving farther apart). |