FleetCor Technologies is a provider of digital payment solutions. Co. has three reportable segments, North America, International, and Brazil. Co.'s proprietary processing and card management solutions provide customers with capabilities including: customizable user-level controls, detailed transaction reporting, programmable alerts, configurable networks, contract price validation and audit, and tax management and reporting. Co.'s Corporate Payments solutions are designed to help businesses streamline the back-office operations associated with making outgoing payments. Co. provides integrated gift card program management and processing services, in both plastic and digital form.
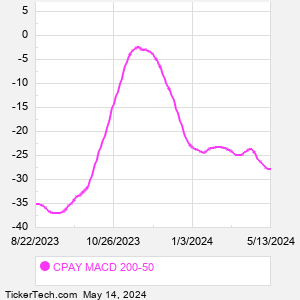
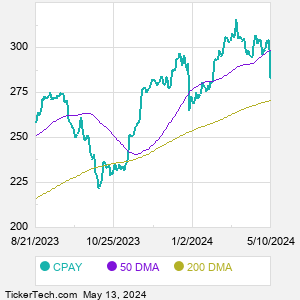
When researching a stock like Corplay, many investors are the most familiar with Fundamental Analysis — looking at a company's balance sheet, earnings, revenues, and what's happening in that company's underlying business. Investors who use Fundamental Analysis to identify good stocks to buy or sell can also benefit from CPAY Technical Analysis to help find a good entry or exit point. Technical Analysis is blind to the fundamentals and looks only at the trading data for CPAY stock — the real life supply and demand for the stock over time — and examines that data in different ways. One of those ways is to calculate a Simpe Moving Average ("SMA") by looking back a certain number of days. One of the most popular "longer look-backs" is the CPAY 200 day moving average ("CPAY 200 DMA"), while one of the most popular "shorter look-backs" is the CPAY 50 day moving average ("CPAY 50 DMA"). A chart showing both of these popular moving averages is shown on this page for Corplay. Comparing two moving averages against each other can be a useful visualization tool: by calculating the difference between the CPAY 200 DMA and the CPAY 50 DMA, we get a moving average convergence divergence indicator ("CPAY MACD"). The CPAY MACD chart, in conjunction with the chart of the moving averages, basically helps in visualizing how the moving averages are showing convergence (moving closer together), or divergence (moving farther apart). |