Darden Restaurants is a restaurant company. Co. owns and operates restaurants through its subsidiaries in the U.S. and Canada under several trademarks. Co. has four reportable segments: Olive Garden, which is a dining Italian restaurant operator; LongHorn Steakhouse, which is a steakhouse restaurant brand with locations primarily in the eastern U.S.; Fine Dining, which includes The Capital Grille and Eddie V's, both are fine dining restaurant brands with locations in main metropolitan cities in the U.S.; and Other Business, which includes the following restaurant brands, Cheddar's Scratch Kitchen, Yard House, Bahama Breeze, Seasons 52, and The Capital Burger.
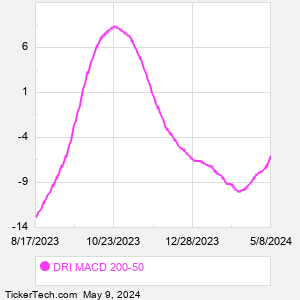
When researching a stock like Darden Restaurants, many investors are the most familiar with Fundamental Analysis — looking at a company's balance sheet, earnings, revenues, and what's happening in that company's underlying business. Investors who use Fundamental Analysis to identify good stocks to buy or sell can also benefit from DRI Technical Analysis to help find a good entry or exit point. Technical Analysis is blind to the fundamentals and looks only at the trading data for DRI stock — the real life supply and demand for the stock over time — and examines that data in different ways. One of those ways is to calculate a Simpe Moving Average ("SMA") by looking back a certain number of days. One of the most popular "longer look-backs" is the DRI 200 day moving average ("DRI 200 DMA"), while one of the most popular "shorter look-backs" is the DRI 50 day moving average ("DRI 50 DMA"). A chart showing both of these popular moving averages is shown on this page for Darden Restaurants. Comparing two moving averages against each other can be a useful visualization tool: by calculating the difference between the DRI 200 DMA and the DRI 50 DMA, we get a moving average convergence divergence indicator ("DRI MACD"). The DRI MACD chart, in conjunction with the chart of the moving averages, basically helps in visualizing how the moving averages are showing convergence (moving closer together), or divergence (moving farther apart). |