FCX MACD
As of date:9/28/2023
FCX stock price:37.33
FCX 50 DMA:40.40
FCX 200 DMA:39.71
FCX MACD (200-50):-0.69

Also see:
FCX Market Cap History
FCX Shares Outstanding History
FCX YTD Return
FCX DMA
FCX RSI
FCX Technical Analysis

Invesco Biotechnology & Genome Getting Very Oversold
1 hour, 22 minutes ago


Shares of XHE Now Oversold
1 hour, 23 minutes ago


First Trust Consumer Staples AlphaDEX Fund (FXG) Enters Oversold Territory
1 hour, 23 minutes ago


iShares Bloomberg Roll Select Commodity Strategy Breaks Below 200-Day Moving Average - Notable for CMDY
1 hour, 27 minutes ago


BCD Shares Cross Below 200 DMA
1 hour, 27 minutes ago


Bullish Two Hundred Day Moving Average Cross - WHF
1 hour, 29 minutes ago


Altius Minerals Breaks Above 200-Day Moving Average - Bullish for ATUSF
1 hour, 33 minutes ago


Altius Minerals Breaks Above 200-Day Moving Average - Bullish for ALS.CA
2 hours, 6 minutes ago


TECSYS Breaks Above 200-Day Moving Average - Bullish for TCS.CA
2 hours, 6 minutes ago


PG&E (PCG) Shares Enter Oversold Territory
2 hours, 6 minutes ago


OPRA Crosses Below Key Moving Average Level
6 hours, 2 minutes ago


GGAL Crosses Below Key Moving Average Level
6 hours, 2 minutes ago


FVCB Makes Bullish Cross Above Critical Moving Average
6 hours, 3 minutes ago


Commerzbank Breaks Above 200-Day Moving Average - Bullish for CRZBY
6 hours, 3 minutes ago


GGAL Crosses Below Key Moving Average Level
6 hours, 10 minutes ago


More Technical Analysis News

FCX MACDFCX DMA
Freeport-McMoRan is a holding company. Through its subsidiaries, Co. is a mining company. Co. operates assets with proven and probable reserves of copper, gold and molybdenum, and Co. is a publicly traded copper producer. Co.'s portfolio of assets includes the Grasberg minerals district in Indonesia, a copper and gold deposit; and mining operations in North America and South America, including the Morenci minerals district in Arizona and the Cerro Verde operation in Peru. Co.'s reportable segments include the Morenci, Cerro Verde and Grasberg (Indonesia mining) copper mines, the Rod and Refining operations, and Atlantic Copper Smelting and Refining.

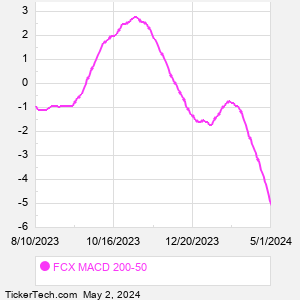
When researching a stock like Freeport-McMoran Copper and Gold, many investors are the most familiar with Fundamental Analysis — looking at a company's balance sheet, earnings, revenues, and what's happening in that company's underlying business. Investors who use Fundamental Analysis to identify good stocks to buy or sell can also benefit from FCX Technical Analysis to help find a good entry or exit point. Technical Analysis is blind to the fundamentals and looks only at the trading data for FCX stock — the real life supply and demand for the stock over time — and examines that data in different ways. One of those ways is to calculate a Simpe Moving Average ("SMA") by looking back a certain number of days. One of the most popular "longer look-backs" is the FCX 200 day moving average ("FCX 200 DMA"), while one of the most popular "shorter look-backs" is the FCX 50 day moving average ("FCX 50 DMA"). A chart showing both of these popular moving averages is shown on this page for Freeport-McMoran Copper and Gold. Comparing two moving averages against each other can be a useful visualization tool: by calculating the difference between the FCX 200 DMA and the FCX 50 DMA, we get a moving average convergence divergence indicator ("FCX MACD"). The FCX MACD chart, in conjunction with the chart of the moving averages, basically helps in visualizing how the moving averages are showing convergence (moving closer together), or divergence (moving farther apart).
10 Most Oversold S&P 500 Stocks
10 Most Overbought S&P 500 Stocks

10 ETFs With Stocks Insiders Are Buying
10 ETFs With Most Upside To Targets
The DividendRank Top 25
Warren Buffett Dividend Stocks
10 Cheap Dividend Stocks Under $10
10 Top DividendRank'ed Energy Stocks
The 10 Highest Yielding Preferred Stocks
The 15 Most Active S&P Call & Put Options
Quotes delayed 20 minutes

Email EnvelopeFree FCX Email Alerts:
Get Dividend Alerts
Get SEC Filing Alerts
Video: Technical Analysis


If the video does not load after a few moments, Upgrade to the Latest Flash Player.
Freeport-McMoran Copper and Gold (FCX) is categorized under the Materials sector; to help you further research MACD, below are some other companies in the same sector:

FMC MACD
HWM MACD
IFF MACD
IP MACD
LIN MACD
LYB MACD
MAS MACD
MHK MACD
MLM MACD
MOS MACD
More Materials companies »


FCX MACD | www.StockMACD.com | Copyright © 2019 - 2023, All Rights Reserved

Nothing in StockMACD.com is intended to be investment advice, nor does it represent the opinion of, counsel from, or recommendations by BNK Invest Inc. or any of its affiliates, subsidiaries or partners. None of the information contained herein constitutes a recommendation that any particular security, portfolio, transaction, or investment strategy is suitable for any specific person. All viewers agree that under no circumstances will BNK Invest, Inc,. its subsidiaries, partners, officers, employees, affiliates, or agents be held liable for any loss or damage caused by your reliance on information obtained. By visiting, using or viewing this site, you agree to the following Full Disclaimer & Terms of Use and Privacy Policy. Video widget and market videos powered by Market News Video. Quote and option data delayed at least 15 minutes; stock quote data powered by Ticker Technologies, and Mergent.
X
Wait! Don't leave yet.
Want to receive our latest research absolutely free?


Click the button below for your complimentary copy of Your Early Retirement Portfolio: Dividends Up to 7.8%—Every Month—Forever.

You'll discover the details on 4 stocks and funds that pay you massive dividends as high as 7.8%.