Genuine Parts is a service organization engaged in the distribution of automotive and industrial replacement parts. Co.'s segments are: Automotive Parts Group, which distributes automotive parts, accessories and service items and provides inventory, cataloging, marketing, training and other programs to the automotive aftermarket; and Industrial Parts Group, which includes its subsidiary, Motion Industries, Inc., that distributes industrial replacement parts and related supplies such as bearings, mechanical and electrical power transmission products, industrial automation and robotics, hose, hydraulic and pneumatic components, industrial and safety supplies and material handling products.
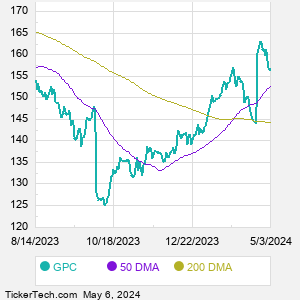
When researching a stock like Genuine Parts, many investors are the most familiar with Fundamental Analysis — looking at a company's balance sheet, earnings, revenues, and what's happening in that company's underlying business. Investors who use Fundamental Analysis to identify good stocks to buy or sell can also benefit from GPC Technical Analysis to help find a good entry or exit point. Technical Analysis is blind to the fundamentals and looks only at the trading data for GPC stock — the real life supply and demand for the stock over time — and examines that data in different ways. One of those ways is to calculate a Simpe Moving Average ("SMA") by looking back a certain number of days. One of the most popular "longer look-backs" is the GPC 200 day moving average ("GPC 200 DMA"), while one of the most popular "shorter look-backs" is the GPC 50 day moving average ("GPC 50 DMA"). A chart showing both of these popular moving averages is shown on this page for Genuine Parts. Comparing two moving averages against each other can be a useful visualization tool: by calculating the difference between the GPC 200 DMA and the GPC 50 DMA, we get a moving average convergence divergence indicator ("GPC MACD"). The GPC MACD chart, in conjunction with the chart of the moving averages, basically helps in visualizing how the moving averages are showing convergence (moving closer together), or divergence (moving farther apart). |