Hess is a global exploration and production company engaged in exploration, development, production, transportation, purchase and sale of crude oil, natural gas liquids (NGL), and natural gas with production operations located primarily in the U.S., Guyana, the Malaysia/Thailand Joint Development Area, and Malaysia. Co.'s Midstream operating segment provides fee-based services, including gathering, compressing and processing natural gas and fractionating NGL; gathering, terminaling, loading and transporting crude oil and NGL; storing and terminaling propane, and water handling services primarily in the Bakken shale play in the Williston Basin area of North Dakota.
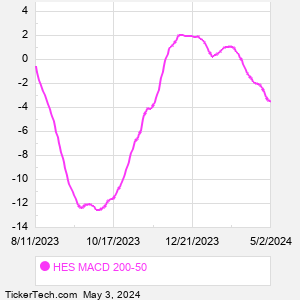
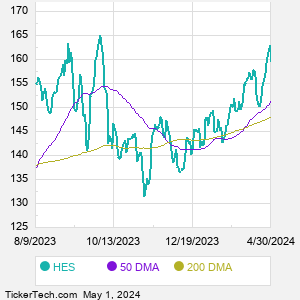
When researching a stock like Hess, many investors are the most familiar with Fundamental Analysis — looking at a company's balance sheet, earnings, revenues, and what's happening in that company's underlying business. Investors who use Fundamental Analysis to identify good stocks to buy or sell can also benefit from HES Technical Analysis to help find a good entry or exit point. Technical Analysis is blind to the fundamentals and looks only at the trading data for HES stock — the real life supply and demand for the stock over time — and examines that data in different ways. One of those ways is to calculate a Simpe Moving Average ("SMA") by looking back a certain number of days. One of the most popular "longer look-backs" is the HES 200 day moving average ("HES 200 DMA"), while one of the most popular "shorter look-backs" is the HES 50 day moving average ("HES 50 DMA"). A chart showing both of these popular moving averages is shown on this page for Hess. Comparing two moving averages against each other can be a useful visualization tool: by calculating the difference between the HES 200 DMA and the HES 50 DMA, we get a moving average convergence divergence indicator ("HES MACD"). The HES MACD chart, in conjunction with the chart of the moving averages, basically helps in visualizing how the moving averages are showing convergence (moving closer together), or divergence (moving farther apart). |