Hewlett Packard Enterprise is a technology provider. Co.'s operations has six business segments: Compute, which provides both general purpose servers for multi-workload computing and workload-optimized servers; High Performance Computing and Artificial Intelligence, which provides integrated systems comprised of software and hardware; Storage, which includes primary storage product and service offerings; Intelligent Edge, which comprises of a portfolio of secure edge-to-cloud solutions operating under the Aruba brand; Financial Services, which provides flexible investment solutions; and Corporate Investments and Other, which includes the Advisory and Professional Services business.
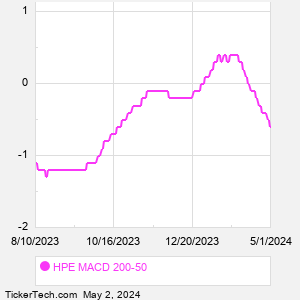
When researching a stock like Hewlett Packard Enterprise, many investors are the most familiar with Fundamental Analysis — looking at a company's balance sheet, earnings, revenues, and what's happening in that company's underlying business. Investors who use Fundamental Analysis to identify good stocks to buy or sell can also benefit from HPE Technical Analysis to help find a good entry or exit point. Technical Analysis is blind to the fundamentals and looks only at the trading data for HPE stock — the real life supply and demand for the stock over time — and examines that data in different ways. One of those ways is to calculate a Simpe Moving Average ("SMA") by looking back a certain number of days. One of the most popular "longer look-backs" is the HPE 200 day moving average ("HPE 200 DMA"), while one of the most popular "shorter look-backs" is the HPE 50 day moving average ("HPE 50 DMA"). A chart showing both of these popular moving averages is shown on this page for Hewlett Packard Enterprise. Comparing two moving averages against each other can be a useful visualization tool: by calculating the difference between the HPE 200 DMA and the HPE 50 DMA, we get a moving average convergence divergence indicator ("HPE MACD"). The HPE MACD chart, in conjunction with the chart of the moving averages, basically helps in visualizing how the moving averages are showing convergence (moving closer together), or divergence (moving farther apart). |